Introduction
Most early-stage B2B SaaS founders spend less than a day thinking through pricing. Yet research shows that a 1% improvement in pricing delivers 12.7% improvement in bottom-line results — roughly four times more effective than improving customer acquisition.
This guide covers the most common B2B SaaS pricing models, the framework that determines whether a model actually works (value metric selection, packaging structure, and price levels), and how to choose the right approach for your stage. By the end, you'll have a decision framework you can apply to your specific product and customer base — built for action, not just comparison.
Key Takeaways
- Real pricing leverage comes from value metric selection, packaging structure, and price levels that hold in real deals
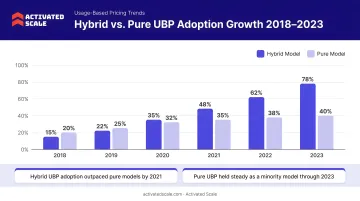
- Most B2B SaaS companies eventually adopt hybrid models (base fee + usage) because pure subscription caps expansion revenue and pure usage creates volatility
- Early-stage companies benefit from simpler models initially, then migrate toward usage-based or hybrid structures as customer patterns emerge
- Testing pricing with experienced sales professionals generates real deal data faster than surveys or competitor analysis
The 6 Most Common B2B SaaS Pricing Models
Pricing models define the billing structure — the container. Understanding them is the first step before making the harder decisions about what to charge on and how to package offerings.
Flat-Rate Pricing
Flat-rate pricing charges one fixed price for full access regardless of usage or team size. The advantage is billing simplicity — customers don't ration their usage or worry about unpredictable bills. The trade-off is severe: no expansion revenue as customer usage grows.
This model works best for niche, focused products where all customers derive similar value. Basecamp charges $299/month for unlimited users and projects, appealing to teams that value predictable costs. Co-founder Jason Fried later acknowledged the problem: large organizations with hundreds of users paid the same as five-person startups, creating unsustainable unit economics.
Basecamp eventually moved away from its original $99 unlimited plan. The reason was structural — software costs like data storage, processing, bandwidth, support, and security scale with users even when revenue doesn't.
Key takeaway: Flat-rate pricing removes friction but caps your upside. Use it only when customer value doesn't vary meaningfully with usage or team size.
Per-User (Per-Seat) Pricing
Per-seat pricing charges a recurring fee per active user. It's transparent, easy to understand, and scales naturally with team growth. Slack charges $7.25/user/month for its Pro plan, while Salesforce has used per-seat pricing across its product lines for decades.
The critical trade-off: per-seat assumes every seat delivers equal value, which rarely holds in practice. Power users and light users pay the same, creating misalignment. Research from CRV shows that while more than 80% of SaaS companies still use some form of seat-based pricing, reliance on seats as the sole value metric has collapsed to approximately 8% of the market. The reason? Seat-based pricing creates an NRR headwind because customers watching their spend will delay adding seats as long as possible.
Key takeaway: Per-seat works best for collaboration and communication tools where headcount correlates directly with value. It breaks down when users derive vastly different levels of utility from the product.
Usage-Based Pricing
Usage-based pricing ties the bill to measurable consumption — API calls, transactions, data volume, compute hours. AWS pioneered this model with its pay-as-you-go approach: customers pay only for what they use, with no long-term contracts.
The alignment between cost and value received lowers the adoption barrier. The risk? Customers may ration usage to control the bill, suppressing the very adoption the product needs. Kyle Poyar identifies this as the "taximeter effect" — when customers artificially constrain consumption because they're watching the meter run.
OpenView's research shows usage-based pricing adoption grew from 27% in 2018 to a peak of 46% in 2022, then dipped to 41% in 2023 as enthusiasm cooled. Of those using usage-based pricing, only 15% have rolled out a largely usage-based model, while 46% take a hybrid approach — hybrid is three times more common than pure usage-based pricing.
Bottom line: Usage-based pricing works when there's a clear, measurable unit that scales with customer outcomes. Pure models introduce revenue volatility and can suppress adoption if customers fear unpredictable bills.
Tiered Pricing
Tiered pricing is often mislabeled as a pricing model when it's actually a packaging structure — Good/Better/Best tiers that can sit on top of any billing model. HubSpot uses classic tiered packaging: Free tools, Starter, Professional, and Enterprise plans across its product hubs.
Tiers appeal to a wider customer range and create natural upgrade paths. The risk lies in building tiers around average usage instead of distinct customer groups. When tiers are designed around statistical averages, no tier fits anyone well — resulting in customers either overpaying or underbuying.
Key takeaway: Tiered packaging works when each tier maps to a distinct customer segment with predictable needs. Design tiers around buyer groups, not usage statistics.
Freemium
Freemium offers a functional free tier to drive adoption, with a paid upgrade path. Lower acquisition barriers and potential network effects make it a natural fit for products that benefit from wide distribution. The design challenge is critical — the free-to-paid boundary must be set so free users experience enough value to convert, but not so much that payment feels unnecessary.
Slack's free plan limits users to the most recent 90 days of message and file history — a well-designed conversion trigger. As teams rely more on Slack, the need to access older conversations becomes inevitable. Industry benchmarks place freemium-to-paid conversion at 2-5% for B2B SaaS, compared to 15-20% for free trials.
Where it breaks down: Freemium requires the same licensing and packaging rigor as any paid model. Don't treat the free tier as an afterthought — it's a deliberate product design decision.
Hybrid Models
Most B2B SaaS companies eventually land on a hybrid model: fixed base fee plus variable usage component. Pure subscription caps expansion revenue; pure usage-based creates revenue volatility. Hybrid models deliver a predictable revenue floor with scaling upside.
Snowflake uses consumption-based pricing with credits for compute and flat-rate storage per terabyte. Twilio combines pay-as-you-go usage pricing for messaging and voice APIs with account minimums for enterprise customers.
If buyers can't forecast their bill at 2x or 5x scale without a spreadsheet, expansion conversations stall. That predictability requirement is the discipline hybrid models demand most.
The NRR data makes the case: research from FE International shows usage-based and hybrid models consistently produce NRR in the 115-130% range, while flat-rate models typically fall in the 95-105% range.
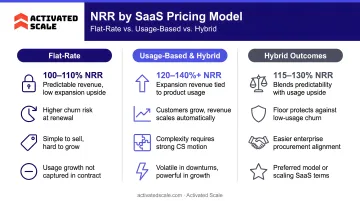
Key takeaway: Hybrid models balance predictability and growth. The critical success factor is cost predictability — customers need to forecast their bill as they scale without extensive financial modeling.
Beyond the Model: The Value Metric, Packaging, and Pricing Framework
The pricing model (per-seat, usage-based, flat-rate) is just the delivery mechanism. The three decisions that determine whether pricing actually works are:
- The value metric you charge on
- How you package capabilities into offerings
- What price levels hold up in real deals
Most founders pick the model first and retrofit everything else — which is why pricing breaks under procurement scrutiny.
Value Metric: What You're Actually Charging On
The value metric is the single highest-leverage pricing decision. It answers: "What does the customer pay more for as they get more value?"
A per-seat model tells you the billing structure, but "seat" may not be how the buyer measures value. If they measure value in transactions processed or decisions supported, a seat count misrepresents the price-value relationship.
A misaligned metric limits adoption (customers ration usage) or creates friction at renewal when a CFO questions 200 seats with only 40 daily users. Patrick Campbell's framework identifies three customer priorities a strong value metric should align with:
- Revenue you bring them
- Costs you save them
- Efficiency you add
Take insurance claims processing: charging per user makes less sense than charging per claim processed or per policy managed — because that's how the customer actually measures ROI.
Packaging: Structuring Offerings Around Customer Groups
Packaging (which features go in which plan) should be built around customer groups — clusters of buyers who derive value from the product in similar ways. Not around average usage or company size.
The common mistake is "t-shirt sizing" tiers that fit no one because they're designed around the statistical average. Good packaging reduces evaluation burden, makes the buyer's choice obvious, and prevents procurement from flagging complexity risk.
Consider a three-tier structure: a Basic plan for solopreneurs, Professional for small teams needing collaboration features, and Enterprise for companies requiring SSO, audit logs, and SLAs. Each tier maps to a distinct buyer segment with predictable needs.
Pricing: What Actually Holds in Real Deals
Price levels should be derived from transaction data — actual win rates, discount depth, deal velocity, renewal patterns — not competitor benchmarks or survey willingness-to-pay.
Hypothetical pricing methods systematically overstate what buyers will actually pay. Schmidt and Bijmolt's peer-reviewed research puts the average willingness-to-pay overestimation at 21% across methods, with indirect methods like conjoint analysis overestimating by a wider margin than direct surveys.
What to look for in your deal data:
- Which price points stall deals
- Where discounting pressure first appears
- At what levels renewal rates shift
- Which customer segments show price sensitivity vs. value sensitivity
Your pricing architecture is only as good as the transaction data behind it. Survey responses and competitor benchmarks are weak proxies for what buyers will actually pay once procurement gets involved.
How to Choose the Right Pricing Model for Your Stage
Model selection becomes straightforward after the upstream work (value metric, packaging, price levels) is done. Frame this as a decision process, not a comparison table.
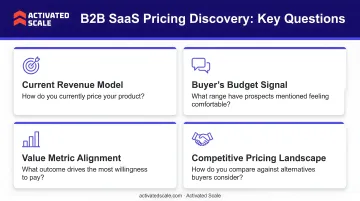
Ask Four Questions Before Picking a Model
1. How does the buyer measure ROI?
If by headcount, per-seat works. If by outcomes or activity volume, the metric should reflect that. A recruiting platform might charge per hire, not per recruiter seat. A BI tool might charge per dashboard or data source, not per analyst.
2. What happens to your revenue if usage moves 10x in either direction?
Model the downside, not just the upside. If a customer's usage drops 90%, does your revenue collapse? If it grows 10x, do you capture meaningful expansion? Usage-based models amplify volatility in both directions.
3. Can procurement evaluate your pricing in one meeting?
If not, the packaging is too complex. Enterprise buyers need to forecast their bill at 2x or 5x scale without building a spreadsheet. Complexity kills deals in procurement review.
4. Does your transaction data support the model?
If you have enough deal history, let it inform the choice rather than relying on competitor benchmarks. Look at which price structures closed fastest, which required heavy discounting, and which customers expanded vs. churned.
Match the Model to Your Growth Stage
Early-stage companies (pre-product-market fit) often benefit from simpler models — flat-rate or basic tiered pricing. Simpler structures reduce friction in early customer conversations and generate cleaner feedback on value.
As the customer base grows and usage patterns emerge, migrate toward usage-based or hybrid structures. Basecamp's evolution demonstrates this: they launched tiered pricing, migrated to flat-rate at $99/month for simplicity, then moved to $299/month flat-rate after recognizing unit economics constraints with large accounts.
The first pricing model does not need to be the final one. The goal is to get deals closed, collect data, and refine.
Validate Pricing with Real Sales Conversations
Pricing hypotheses only get validated in real buyer interactions — not surveys or competitor benchmarks. Three signals tell you whether your model is working:
- Deals closing without heavy discounting — price resistance usually points to a misaligned value metric, not just a high number
- Prospects able to forecast their bill at scale — if buyers need a spreadsheet to evaluate cost, the packaging is too complex
- Expansion revenue appearing naturally — customers upgrading without a sales push confirms the model matches how they consume value
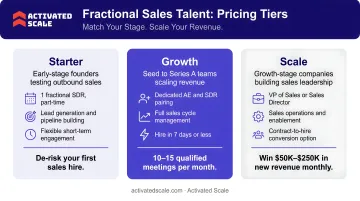
Early-stage founders often lack the deal volume to spot these patterns reliably. Running a structured pricing test across 8–10 qualified deals — with an experienced AE who can probe objections and report back — is one of the fastest ways to validate before locking in a pricing architecture.
Activated Scale connects early-stage B2B SaaS companies with fractional Account Executives on a contract basis, deployable in under 10 days. Founders get real deal data from reps experienced in $10K–$100K+ ARR deal sizes without committing to a full-time hire.
Common Pricing Mistakes That Kill Early Revenue
Undercharging: Approximately 20% of SaaS companies underprice their products — often by copying competitor prices or anchoring to cost of goods rather than value delivered.
Early underpricing creates a floor that's hard to raise without customer backlash. It also signals low quality to enterprise buyers who use price as a proxy for legitimacy. A $49/month product competing against $499/month alternatives raises questions about feature parity, support quality, and vendor stability.
Building complexity before product-market fit: Too many tiers, too many add-ons, too many conditions. The practical consequence? Deals slow down in procurement, sales reps bypass the packaging by discounting to make it simple, and the pricing architecture never generates the upsell data it was designed to produce.
Treating the pricing model as permanent: Most B2B SaaS companies will iterate on pricing multiple times. The real risk is changing it reactively, without data — that's what creates customer confusion and churn.
Planned pricing evolution, communicated transparently, is far less damaging than an unplanned pivot. When you do raise prices, give customers a clear path forward:
- Notice window: 30–90 days minimum, with a clear explanation of what's changing and why
- Value justification: Tie the change to specific improvements — new features, expanded support, better SLAs
- Customer choice: Offer a time-limited grandfather rate, a migration incentive, or a feature-matched transition plan
Key Metrics to Know If Your Pricing Is Working
MRR/ARR, NRR, and ARPA: Every B2B SaaS company should monitor Monthly Recurring Revenue (MRR) or Annual Recurring Revenue (ARR) as the predictable revenue base. Net Revenue Retention (NRR) measures whether existing customers expand or contract over time. Average Revenue Per Account (ARPA) signals whether the pricing model is capturing value correctly.
NRR benchmarks by segment:
- Enterprise (ACV >$100K): 118% median NRR
- Mid-Market ($25K-$100K): 108%
- SMB (<$25K): 97%
Top-quartile companies exceed 130%. ChartMogul research shows companies with NRR over 100% grow 1.5-3x faster than peers.
Diagnostic signal of metric mismatch: If your highest-engagement, highest-NPS customers are paying disproportionately less than low-engagement customers, the value metric is wrong. This pattern produces churn that looks like a product problem but is actually a pricing architecture problem.
To confirm the pattern, run cohort analysis comparing engagement metrics against revenue per account. If your most engaged customers sit in the lowest revenue quartile, a competitor with better pricing alignment will take them. Key metrics to cross-reference:
- Daily active users vs. revenue tier
- Feature adoption depth vs. ARPA
- Support ticket volume vs. contract value
CAC to LTV ratio: Customer Acquisition Cost to Lifetime Value ratio serves as a pricing efficiency check. A high CAC relative to LTV points to one of three problems:
- Price point is too low for the segment you're acquiring
- Expansion motion is broken (no upsell or seat growth)
- Churn is eroding value faster than new acquisition replaces it
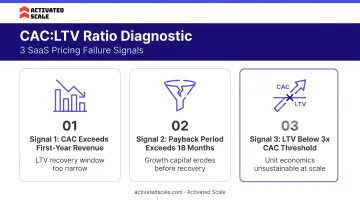
Healthy SaaS businesses maintain an LTV:CAC ratio of at least 3:1. At 4:1 or higher, the model is working. At 5:1+, you're likely leaving growth on the table by under-investing in acquisition.
Frequently Asked Questions
What are the most effective pricing models for B2B SaaS businesses?
There is no universally best model — effectiveness depends on how customers measure ROI from the product, whether the value metric encourages full adoption or suppresses it, and whether pricing is simple enough for procurement to evaluate. Most mature B2B SaaS companies end up with hybrid structures combining predictable base fees with usage-based expansion.
What is the 3-3-2-2-2 rule of SaaS?
The 3-3-2-2-2 rule (also called T2D3) is a growth benchmark coined by Battery Ventures describing an ideal revenue trajectory: triple revenue for two consecutive years, then double for three consecutive years. Sustained growth at this rate requires a pricing model that captures expansion revenue, not just new logo acquisition.
What are the main pricing frameworks and types used in pricing strategies (e.g., the 3 C's, 5 C's, and common pricing types)?
The 3 C's framework (Cost, Competition, Customer value) is a foundational pricing lens. The 5 C's extends this to include Context and Channels. In B2B SaaS, customer value (what the buyer is willing to pay based on ROI) is the most important anchor — cost-based pricing is rarely optimal for software.
What is the difference between a pricing model and a pricing strategy in B2B SaaS?
The pricing model describes the billing structure (per-seat, usage-based, flat-rate). The pricing strategy is broader: it covers what value metric you charge on, how capabilities are packaged, what price levels hold in real deals, and how all of that evolves as the product and market change.
How often should a B2B SaaS company review its pricing model?
Review pricing whenever significant shifts occur in usage patterns, competitive dynamics, or customer segments. Companies with active deal flow should check pricing against transaction data at least quarterly — asking whether the model still reflects how customers actually buy and use the product.
How do I know if my pricing model is causing churn?
If high-engagement, high-NPS customers are paying less than low-engagement ones, the value metric is misaligned. That churn pressure looks like a product gap but requires pricing architecture changes, not new features. Run cohort analysis comparing engagement metrics to revenue per account to confirm the pattern.