_edi.png)
Most SaaS teams think growth comes from adding more leads. In reality, revenue is won or lost after the deal closes. Customers drop off during onboarding, go inactive quietly, or never expand beyond their initial plan, and teams often don’t know where things broke. That’s the gap a structured lifecycle view exposes.
The data backs this shift. Research shows that 61% of B2B revenue comes from existing customers through renewals and expansion. At the same time, Forrester found that companies that prioritize customer experience see 51% higher retention rates.
Yet most teams still manage lifecycle stages in silos, without clear ownership or metrics.
This is where a customer lifecycle operations assessment becomes critical. It helps you identify where revenue leaks, align teams across stages, and fix execution gaps.
In this blog, you’ll learn the lifecycle stages, common breakdowns, and a practical framework for assessing and improving each stage.
Key Takeaways
- A customer lifecycle operations assessment identifies where execution breaks across stages, focusing on process, ownership, metrics, and tools.
- Revenue loss occurs across awareness, acquisition, onboarding, retention, and expansion, primarily due to weak handoffs and unclear stage definitions.
- Clear entry and exit criteria, single ownership per stage, and core metrics like conversion, activation, churn, and NRR are critical for control.
- The biggest leaks come from slow onboarding, poor qualification, and missed expansion signals driven by a lack of real-time data.
- Lifecycle performance improves when teams align on RevOps, use behavior-based triggers, and bring the right roles into each stage.
What Is A Customer Lifecycle Operations Assessment And Why Does It Matter Now?
A customer lifecycle operations assessment evaluates how well your business executes across each stage, not just how those stages are defined. It identifies where customers stall, drop off, or fail to expand.
The urgency is clear. Gartner reports that 60% of software buyers regret their purchases, 24% cancel contracts, and many switch vendors within 12–18 months. These losses rarely come from awareness or acquisition. They happen after the deal closes.
Customer Lifecycle Vs Customer Journey
These two are often confused, which leads to poor analysis and wrong decisions.
Lifecycle tells you where revenue breaks. Journey explains why customers feel friction.
What An Operations Assessment Includes
A proper assessment focuses on execution systems, not surface-level mapping. Before you look at dashboards, validate these four layers.
- Process Clarity: Each stage must have strict entry and exit conditions. Example: Onboarding should end when a user completes a meaningful action, not when an account is created.
- Stage Ownership: Every stage must have a single accountable owner. Example: If onboarding is split between sales and support, accountability gets diluted.
- Metrics Alignment: Each stage needs one primary metric. Example: If sales tracks MQLs and marketing tracks traffic, conversion gaps go unnoticed.
- Tool Stack Integration: CRM, product analytics, and support tools must sync. Example: If product usage data does not flow into CRM, sales miss expansion signals.
Why It Matters Now
Lifecycle inefficiencies are becoming expensive and visible.
- Retention Drives Growth: Studies highlight that post-sale engagement plays a direct role in retention, expansion, and advocacy
- Acquisition Is Getting Costlier: More spend is required to generate the same pipeline quality, making lifecycle efficiency critical.
- Customers Expect Faster Value: If onboarding fails to deliver value early, churn risk increases immediately.
What You Get From A Strong Lifecycle System
When lifecycle operations are aligned, outcomes become measurable:
- Predictable revenue through consistent stage conversion.
- Early detection of churn signals before cancellations.
- Higher expansion revenue through usage insights.
- Faster decision-making due to aligned metrics.
Also Read: Navigating the Seven Stages of Business Growth: A Guide
The 5 Stages Of The Customer Lifecycle And Where Revenue Actually Leaks
A customer lifecycle is not linear. Customers move forward, pause, or drop off based on how well each stage is executed. Most revenue loss happens during transitions between stages, not within them.

In B2B SaaS, the lifecycle typically includes awareness, acquisition, onboarding, engagement, and expansion, each contributing directly to retention and long-term revenue
The key shift most teams miss is that revenue is not created at acquisition. It is protected and expanded post-sale.
Awareness → Are You Attracting The Right Accounts?
This stage determines pipeline quality before sales begin. Poor targeting here compounds inefficiencies across every downstream stage.
What Usually Goes Wrong
- High traffic with low conversion intent.
- Broad targeting instead of ICP precision.
- Overdependence on paid channels without intent filtering.
What Data Shows
- Traffic without ICP alignment leads to poor opportunity conversion rates later.
- Intent-driven acquisition outperforms volume-driven acquisition.
- Misaligned messaging increases drop-off during acquisition.
What Strong Teams Do Differently
- Use firmographic and intent data to target high-fit accounts.
- Align content with specific business problems, not generic features.
- Track ICP traffic percentage, not just total traffic.
Example
A SaaS company ranking for broad keywords like “project management tools” drives traffic but fails to convert. After shifting to intent-driven keywords like “project management for remote engineering teams,” demo bookings increase without increasing traffic.
Acquisition → Where Deals Slow Down
This stage converts interest into revenue. Most of the friction here stems from misalignment between marketing and sales.
What Usually Goes Wrong
- Leads are passed without proper qualification.
- Messaging changes between marketing and sales.
- Sales cycles stretch due to unclear value communication.
Key Signals To Watch
What Data Shows
- Poor qualification leads to longer sales cycles and lower close rates.
- Buyers evaluate multiple vendors, which increases decision complexity.
What Strong Teams Do Differently
- Align marketing and sales on a shared ICP definition.
- Use behavioral signals instead of form fills for qualification.
- Standardize value messaging across all touchpoints.
Example
If a deal stalls after multiple demos, the issue is often unclear ROI communication. Buyers delay decisions when value is not tied to business outcomes.
Onboarding → The Silent Churn Trigger
This is where most churn begins. Customers decide early whether your product delivers value.
What Usually Goes Wrong
- No structured onboarding process.
- Poor handoff from sales to customer success.
- Delayed time-to-value.
What Data Shows
- Customers who achieve value early are more likely to renew and expand.
- Onboarding quality directly impacts retention and lifetime value.
Key Metrics To Track
- Time to first value.
- Onboarding completion rate.
- Early usage activation.
What Strong Teams Do Differently
- Define onboarding milestones tied to customer goals.
- Break onboarding into short phases with measurable outcomes.
- Use proactive communication instead of reactive support.
Example
A SaaS platform introduces guided onboarding with milestone tracking. Users who complete the first key action within 3 days show significantly higher retention than those who do not.
Retention → Are Customers Actually Engaged?
Retention reflects whether customers continue to derive value from the product. It depends on usage, not satisfaction alone.
What Usually Goes Wrong
- Teams rely on support tickets instead of usage data
- No proactive engagement strategy
- Customer success lacks clear ownership
Key Metrics
What Data Shows
- Retention depends on continuous engagement, adoption, and value delivery.
- Declining usage is the earliest signal of churn.
What Strong Teams Do Differently
- Track product usage trends, not just outcomes.
- Use health scores to identify at-risk accounts early.
- Build proactive engagement playbooks.
Insight
Churn is rarely sudden. It follows a pattern:
- Reduced usage
- Lower engagement
- Delayed response
- Cancellation
Expansion → Your Real Growth Engine
Expansion drives revenue growth without increasing acquisition cost. It depends on how well customers realize value.
What Usually Goes Wrong
- Upsell conversations happen only at renewal.
- No structured expansion triggers.
- Customer success focuses only on retention.
What Data Shows
- Expansion follows successful value realization and engagement.
- Behavioral data is a strong predictor of upsell readiness.
Key Signals To Track
- Feature adoption depth.
- Usage frequency of advanced capabilities.
- Account growth indicators.
What High-Performing Teams Do Differently
- Use product usage data to trigger upsell opportunities.
- Align expansion with customer goals, not quotas.
- Build advocacy programs that feed referrals.
Example
A customer who regularly uses advanced analytics features often indicates readiness for an enterprise plan. Triggering expansion conversations at this point increases conversion rates compared to generic upsell campaigns.
Where Most Lifecycle Strategies Break And How To Spot It Early
Lifecycle strategies fail at execution, not planning. The breakdown usually happens across teams and systems. Many companies still prioritize acquisition over retention, even though retention has a stronger impact on revenue
Common Failure Points
- Teams operate independently without shared lifecycle visibility.
- Stage definitions differ across departments.
- Metrics are inconsistent across tools.
- Retention efforts begin after churn signals appear.
Where Breakdowns Typically Happen
Run This Quick Lifecycle Audit
Use this to identify execution gaps before they impact revenue. Start by reviewing these questions across your teams:
- Do You Have Clear Stage Definitions? Each stage must have measurable entry and exit conditions.
- Is Ownership Assigned For Each Stage? Every stage should have a single accountable team or role.
- Can You Track Drop-Offs In Real Time? Delayed visibility hides early churn signals and slows response.
- Are Handoffs Smooth Or Delayed? Most friction happens when responsibility shifts between teams.
What A Strong Lifecycle Setup Looks Like
A well-structured lifecycle system shows clear signals:
- Unified data across CRM, product, and support tools.
- Real-time visibility into stage transitions.
- Clear accountability across teams.
- Actionable insights instead of static reports.
Also Read: Customer Loyalty Strategies That Drive Repeat Business and Growth
How To Run A Customer Lifecycle Operations Assessment
A customer lifecycle operations assessment should show you where handoffs break, where conversion slows, and where retention weakens.
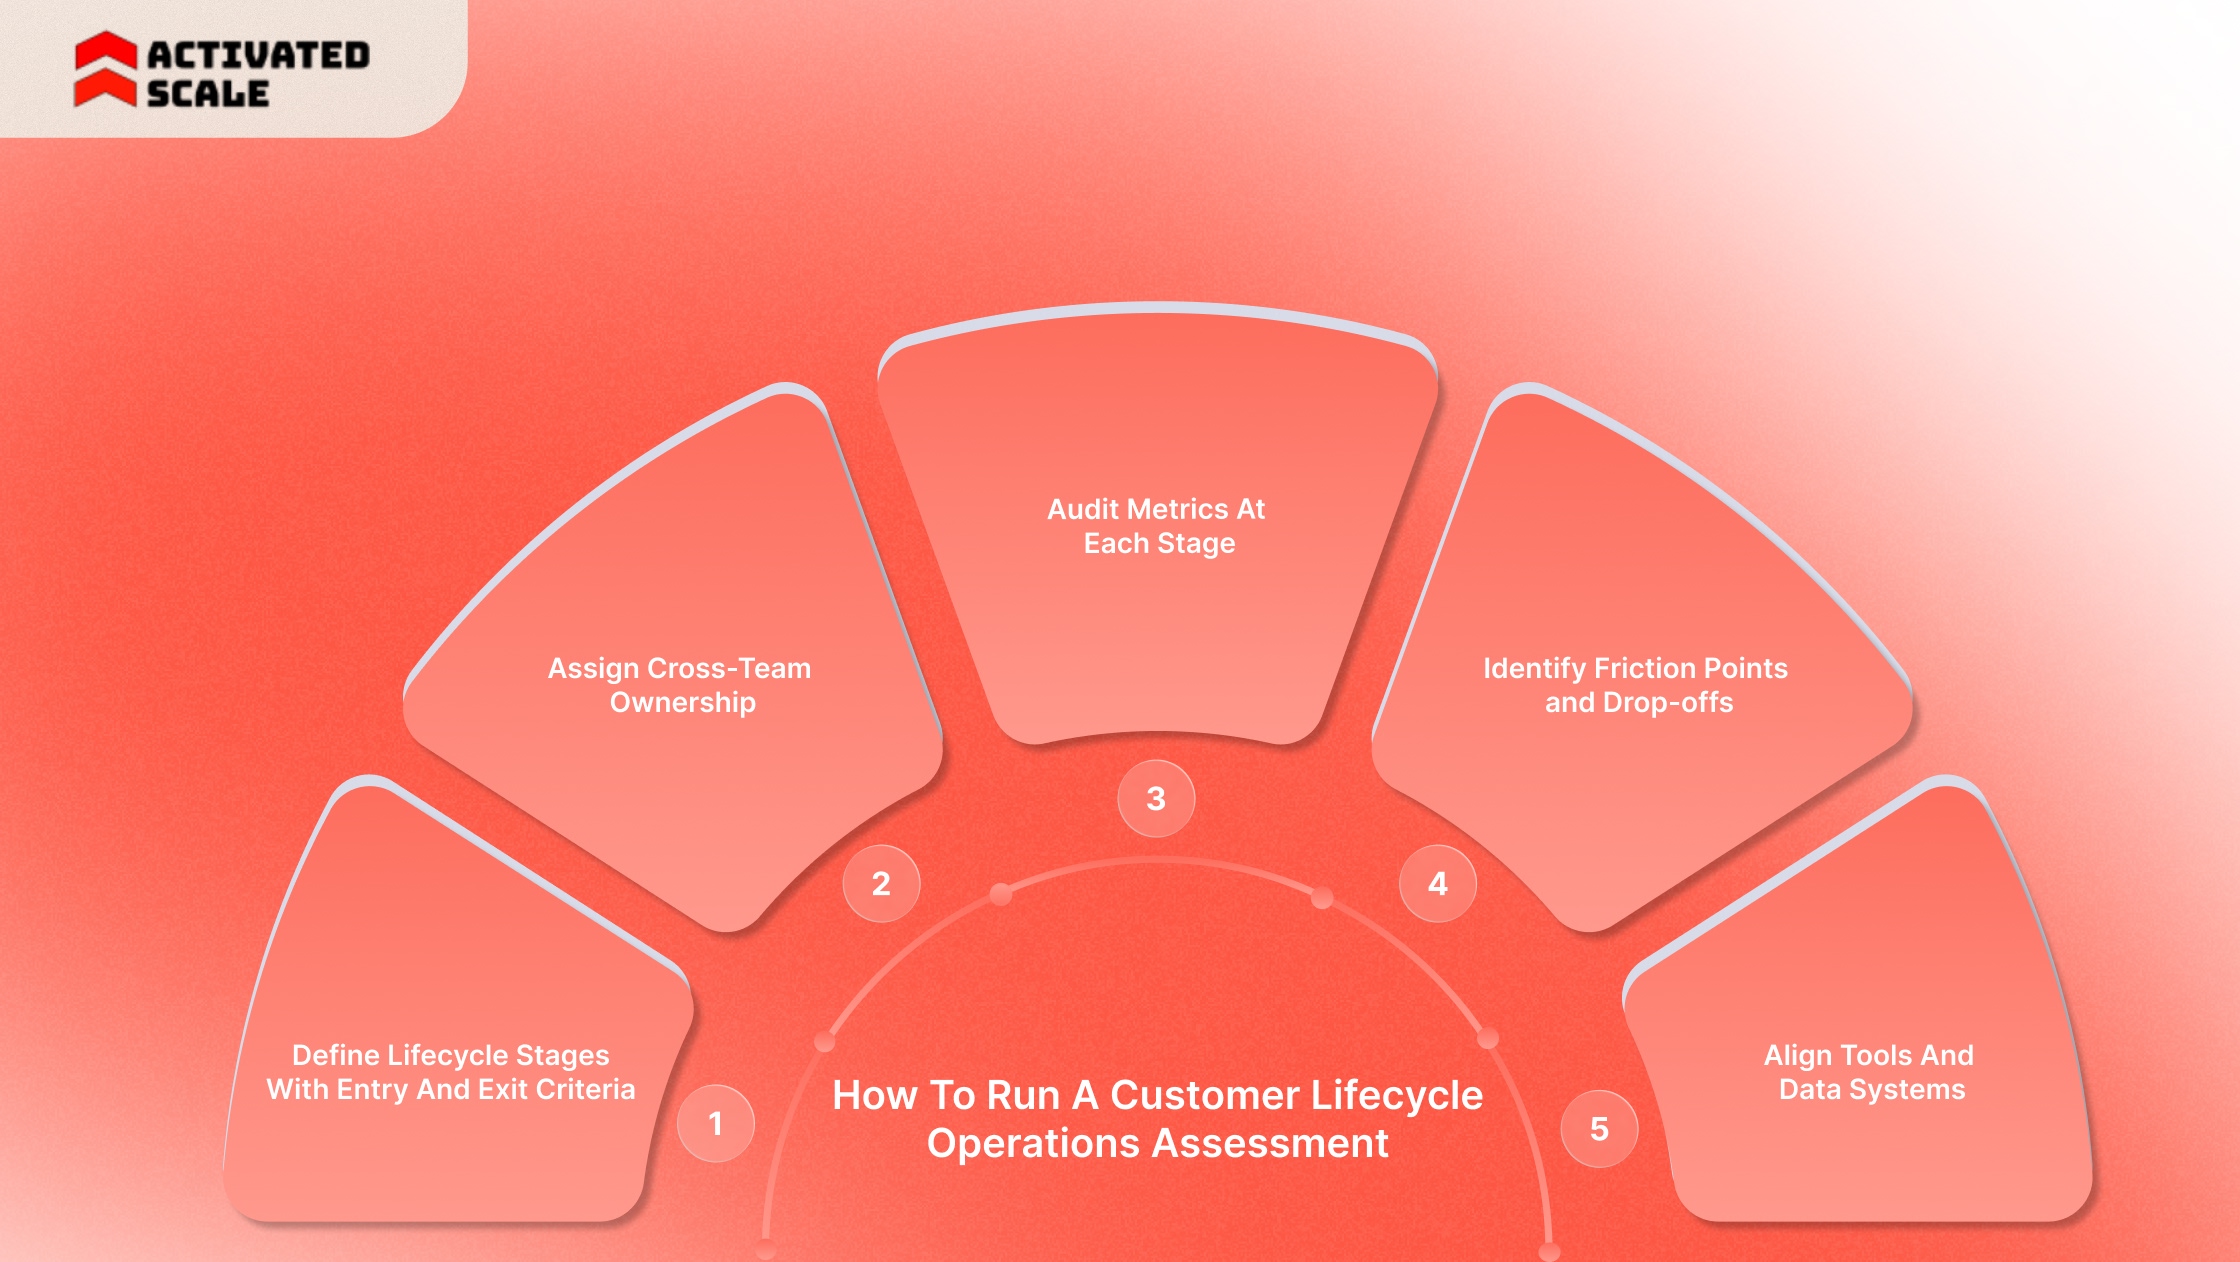
Step 1: Define Lifecycle Stages With Entry And Exit Criteria
Most lifecycle assessments fail at the first step. Teams use the same stage names but mean different things by them. Sales may treat a customer as “onboarded” once the contract is signed.
Customer success may be considered complete only after the customer achieves the first value. Those are not small differences. They change reporting, ownership, and the timing of interventions.
Start by documenting what qualifies an account to enter and exit each stage.
What To Define For Each Stage
Example
A SaaS company says onboarding is complete once the welcome email is sent. Their churn rises in month two.
After redefining onboarding around “first workflow completed by the customer,” they find that most churned accounts never reached that milestone. That changes the problem from customer support to activation design.
Step 2: Assign Ownership Across Marketing, Sales, And Customer Success
A lifecycle map without named owners becomes a reporting exercise. Every stage needs a primary owner, supporting teams, and a handoff rule.
A Practical Ownership Model
What To Check During The Assessment
- Is there one team clearly accountable for stage performance?
- Do handoffs include context, goals, and next steps?
- Does the receiving team accept the handoff criteria?
- Are customers being contacted twice for the same information?
Example
If marketing sends leads based on form fills, but sales only accepts accounts showing buying intent, the breakdown is not volume. It is a mismatch between the stage definition and ownership.
Step 3: Audit Metrics At Each Stage
Once the stages and owners are clear, audit metrics. Pick one core metric per stage and two or three support metrics. When teams track too many numbers, decisions slow down. When they track the wrong number, the wrong team gets blamed.
Core Metrics By Stage
Example
A startup reports strong retention because few accounts fully cancel. Once it adds revenue churn and expansion tracking, it discovers that many customers stay but downgrade. The retention story changes at once.
Step 4: Identify Friction Points and Drop-offs
This is where the assessment becomes useful. You are no longer asking, “Which stage is weakest?” You are asking, “Where exactly do qualified accounts slow down, disengage, or fail to expand?”
Most leakage sits in the gaps between systems and teams.
Common Friction Points
- Marketing generates leads that sales does not trust.
- Sales closes deals with a weak implementation context.
- Onboarding takes too long to reach the first value.
- Customer success reacts only after usage drops.
- Expansion conversations start too late, often near renewal.
A Simple Friction Audit Table
Signals Worth Pulling Into The Review
- Time between closed won and kickoff.
- Time to first key action.
- Product usage drops after week one or month one.
- Renewal risk flags.
- Advanced feature adoption without expansion follow-up.
Example
A company sees acceptable conversion and stable churn, but weak NRR. After mapping friction, it finds that customers are actively using advanced features with no account review process in place. The issue is not retention. It is a missed expansion execution.
Step 5: Align Tools And Data Systems
Your lifecycle cannot be managed well if customer data is scattered. CRM may show deal history. Product analytics may show usage. Customer success may track health in a separate tool. If those views do not connect, lifecycle decisions stay partial.
The Minimum Data Stack You Need
What Good Tool Alignment Looks Like
- Sales can see the onboarding progress after close.
- Customer success can see sales promises and buyer goals.
- Marketing can see which acquisition sources drive retention, not just signups.
- Expansion owners can see product usage signals before renewal season.
Example
If paid campaigns produce more signups but lower activation than organic search, the issue is not just marketing efficiency. It is lifecycle quality by channel. You only catch that when CRM and product data connect.
The Missing Layer: Lifecycle Execution Depends On Who You Hire
A lifecycle framework can look clean on paper and still fail in practice. The missing layer is team design.
Early-stage SaaS companies often hire when a problem becomes urgent. That usually means they hire late, hire broad generalists, or expect one person to cover awareness, pipeline, onboarding, and expansion.
Common Hiring Gaps Across Lifecycle Stages
The fastest way to spot a talent gap is to match weak metrics to the stage owner.
Gap 1: Weak SDR Coverage Creates Poor Pipeline Quality
When awareness and top-of-funnel execution are underpowered, sales gets more noise than opportunity.
Typical signs
- High outreach activity with low-qualified meetings.
- Good website traffic with poor sales acceptance.
- Lead follow-up is slow or inconsistent.
Business effect
- Sales spends time filtering instead of selling.
- Conversion drops before the pipeline is even healthy.
Gap 2: No Onboarding Specialist Creates Early Churn
Many startups assume customer success can be folded into onboarding as just another task. That works until activation stalls.
Typical signs
- New customers wait too long for the kickoff.
- First value takes weeks instead of days.
- Support tickets rise before adoption stabilizes.
Business effect
- Churn risk rises before the customer sees value.
- Expansion becomes harder since the account never matures.
Gap 3: No Sales Leadership Creates Broken Go-To-Market Execution
When nobody owns the sales motion at a strategic level, teams drift into reactive decisions.
Typical signs
- Messaging shifts by rep.
- Forecast quality is poor.
- Partnerships, playbooks, and pipeline design stay unfinished.
Business effect
- Acquisition becomes inconsistent.
- Expansion lacks structure.
- Team productivity depends too much on individual effort.
Stage To Role Mapping
Fixing Lifecycle Gaps With Flexible Hiring
This is where hiring flexibility matters. Not every company needs a full in-house team at once. Many need sharp coverage at one stage right now.
A Practical Hiring Model By Stage
- SDRs For Awareness And Pipeline: Use focused SDR support when lead generation is inconsistent, inbound quality is weak, or founder-led outbound stops scaling.
- AEs For Conversion: Add AEs when opportunities exist, but deals are not progressing cleanly through evaluation and close.
- Sales Leaders For Go-To-Market Strategy: Bring in experienced sales leadership when a pipeline exists but process, messaging, forecasting, or team design are weak.
When Flexible Hiring Makes Sense
Activated Scale addresses this need perfectly. It helps startups bring in fractional SDRs, AEs, and VPs of Sales aligned to specific lifecycle stages, so teams can close execution gaps without waiting through long hiring cycles.
Strategies And Metrics That Improve Lifecycle Performance In 2026
Once the lifecycle is mapped and gaps are visible, execution becomes the next priority. The strongest improvements usually come from three levers: better segmentation, better triggers, and better alignment across the revenue team.

Lifecycle-Based Personalization
Basic personalization changes the name in an email. Lifecycle-based personalization changes the message, timing, and CTA based on where the account actually sits.
What To Personalize By Stage
Why This Works
- Relevance increases response and engagement.
- Teams stop treating all customers the same.
- Expansion becomes easier when messaging matches actual usage.
Trigger-Based Automation
Automation should follow customer behavior, not just calendar dates.
Useful Trigger Examples:
- The customer has not completed the first key action within 7 days.
- Product usage drops below the healthy threshold.
- Advanced feature adoption rises.
- Renewal date approaches with low engagement.
- Multiple stakeholders from the same account start using the platform.
A Better Trigger Design Table
This keeps the team focused on accounts that need attention now, not on those that appear in a weekly export.
Revenue Team Alignment
Lifecycle performance improves when teams use the same definitions and dashboard.
Shared Dashboard Views Worth Building
Metrics That Define Lifecycle Health
Good lifecycle reporting is simple enough to guide action and deep enough to expose problems early.
Core Lifecycle Metrics Table
How To Read These Metrics Together
- A high ICP Lead % with a low Win Rate points to sales or positioning issues.
- Good Win Rate with slow Time To Value points to onboarding friction.
- Strong activation with high Churn suggests value is not sustained.
- Weak NRR with decent retention points to missed expansion.
High-growth teams often adjust hiring based on this data, not gut feel. Activated Scale connects startups with pre-vetted US-based sales reps who can step into specific lifecycle stages and improve execution where the numbers say help is needed most.
Aligning Talent With Each Lifecycle Stage
Strong lifecycle systems depend on having the right expertise at the right stage. Many teams struggle not because of strategy gaps, but because they lack execution roles.
Activated Scale supports this model by providing pre-vetted US-based sales professionals who can plug into specific lifecycle stages and improve execution immediately.
- Contract-to-Hire Sales Recruiting: Test sales talent in real pipeline scenarios before committing to full-time hires.
- Fractional SDRs and AEs: Build a pipeline and close deals without expanding headcount too early.
- Fractional Sales Leadership: Bring in experienced leaders to define GTM strategy, sales process, and forecasting discipline.
Conclusion
A well-run customer lifecycle directly impacts revenue outcomes. You close faster when acquisition is aligned with ICP. You reduce early churn when onboarding is tied to clear activation milestones.
You increase expansion when usage signals trigger timely upsell conversations. Each improvement compounds across the funnel, turning the lifecycle from a cost center into a revenue driver.
The difference comes from execution discipline. Clear stage definitions, shared metrics, and the right roles at each stage remove delays and missed opportunities.
If you want to improve conversion, retention, and expansion without rebuilding your team from scratch, explore how Activated Scale can help you bring in proven sales talent where your lifecycle needs it most.
FAQs
Q: How often should a customer lifecycle operations assessment be conducted?
A: It should be reviewed quarterly at a minimum, but high-growth teams often run monthly lifecycle reviews. This helps track changes in conversion, churn, and expansion trends early. Regular assessments ensure that stage-level issues are identified before they impact revenue targets or forecasting accuracy.
Q: What is the biggest mistake teams make when analyzing lifecycle performance?
A: Most teams analyze stages in isolation instead of focusing on transitions between stages. For example, they measure acquisition performance without checking onboarding delays. This creates blind spots where revenue leakage happens but is not clearly attributed to any single team.
Q: Can small startups implement lifecycle operations without a full RevOps team?
A: Yes, but they need clear stage definitions and basic tracking across CRM and product usage. Early-stage teams can start with simple metrics like conversion rate, activation, and churn. The key is clarity in ownership and consistent tracking, not complex tooling.
Q: How do you prioritize which lifecycle stage to fix first?
A: Start with the stage that directly impacts revenue in the shortest time. For most SaaS teams, onboarding and retention come first since they affect churn and expansion. If the pipeline is weak, then awareness or acquisition should be prioritized instead.
Q: What role does product data play in lifecycle assessment?
A: Product data is critical for understanding customer behavior after acquisition. It shows how often users engage, which features they use, and where they drop off. Without product data, teams rely solely on sales or support signals, which often miss early indicators of churn.
The Ultimate Guide to Hiring a Salesperson!
Get the step-by-step guide to hiring, onboarding, and ensuring success!