_edi.png)

According to Salesforce's 6th Edition State of Sales report, 84% of sales reps missed quota in the year 2023. Not a bad month here and there. An entire year of selling, and the number still had not been hit.
For most startups, the problem is not a lack of effort. It is a lack of structure. Reps are selling. Managers are forecasting. But no one has connected those activities to a plan that accounts for pipeline coverage, team capacity, and quarterly milestones.
That is what the revenue planning process fixes. It gives you a system that tells you what needs to happen, when, and whether your current team can actually deliver it. This guide covers how to build that system, which six metrics to track, and where most startups get it wrong before the quarter even begins.
Key Takeaways
- A revenue planning process turns revenue goals into a clear execution plan by linking targets to pipeline needs, sales capacity, and hiring timelines.
- Revenue targets are only realistic when backed by pipeline math, including deal size, win rate, and the number of opportunities required.
- Tracking the right metrics, such as MRR, ARR, CAC, win rate, and pipeline coverage, shows whether your revenue plan is on track or drifting.
- Quarterly reviews and simple scenario planning help teams adjust early when pipeline, conversion rates, or deal size begin to change.
- Many startups accelerate revenue planning with experienced sales leaders who build the systems and structures needed to support predictable growth.
What Is the Revenue Planning Process?
The revenue planning process is how a company decides what revenue it will generate, maps out how it will achieve that goal, and builds the sales infrastructure to support it.
It is not a one-time forecast. It is an ongoing system that links your annual target to quarterly execution, your quarterly execution to sales team capacity, and your sales capacity to hiring decisions.
What It Covers
A complete revenue planning process addresses:
• Annual and quarterly revenue targets, broken down by product line or customer segment.
• Pipeline coverage requirements needed to hit each target.
• Sales team capacity: how many reps you have, their ramp stage, and their quota.
• Sales cycle assumptions: average deal size, win rate, and time to close.
• Channel mix: which sources generate the most reliable and profitable pipeline
• Hiring timelines tied to revenue ramp and quarterly planning milestones.
Revenue Planning vs. Sales Forecasting
This distinction matters more than most founders realize.
Suggested Read: Understanding the Process and Methods of Sales Forecasting
Why Most Startups Skip Revenue Planning and Pay for It Later
Companies that align people, processes, and technology across revenue teams achieve more revenue and profitability. Yet most early-stage startups operate without any formal revenue planning structure.
The reason is usually the same: things are moving fast, the team is small, and a formal planning process feels like something for later. So founders rely on gut feel and verbal updates from reps.
That works until it does not.
The Three Gaps That Kill Predictability
• No shared definition of the target. Reps and leadership often measure different things. Some track bookings. Others track closed revenue. The number looks hit until finance reconciles it at quarter-end.
• No capacity math behind the goal. Adding two SDRs and expecting 40% revenue growth only works if you know your pipeline conversion rates, average deal size, and ramp time. Without that math, the plan is optimism dressed as strategy.
• No review cadence to catch drift. A stalling channel, a rep behind on the pipeline, a segment with lengthening cycles: these are fixable in week four. By week eleven, the quarter is already gone.
Without a structured approach, growth stays inconsistent and hard to explain. Fixing that starts with putting a clear revenue planning process in place.
Also Read: Outside Sales Rep for Revenue Growth & Account Expansion
The Revenue Planning Process Framework: 5 Steps That Actually Work
A revenue planning process framework need not be complex. It needs to be clear, shared, and used consistently. Here is how to build one that holds up as you scale.
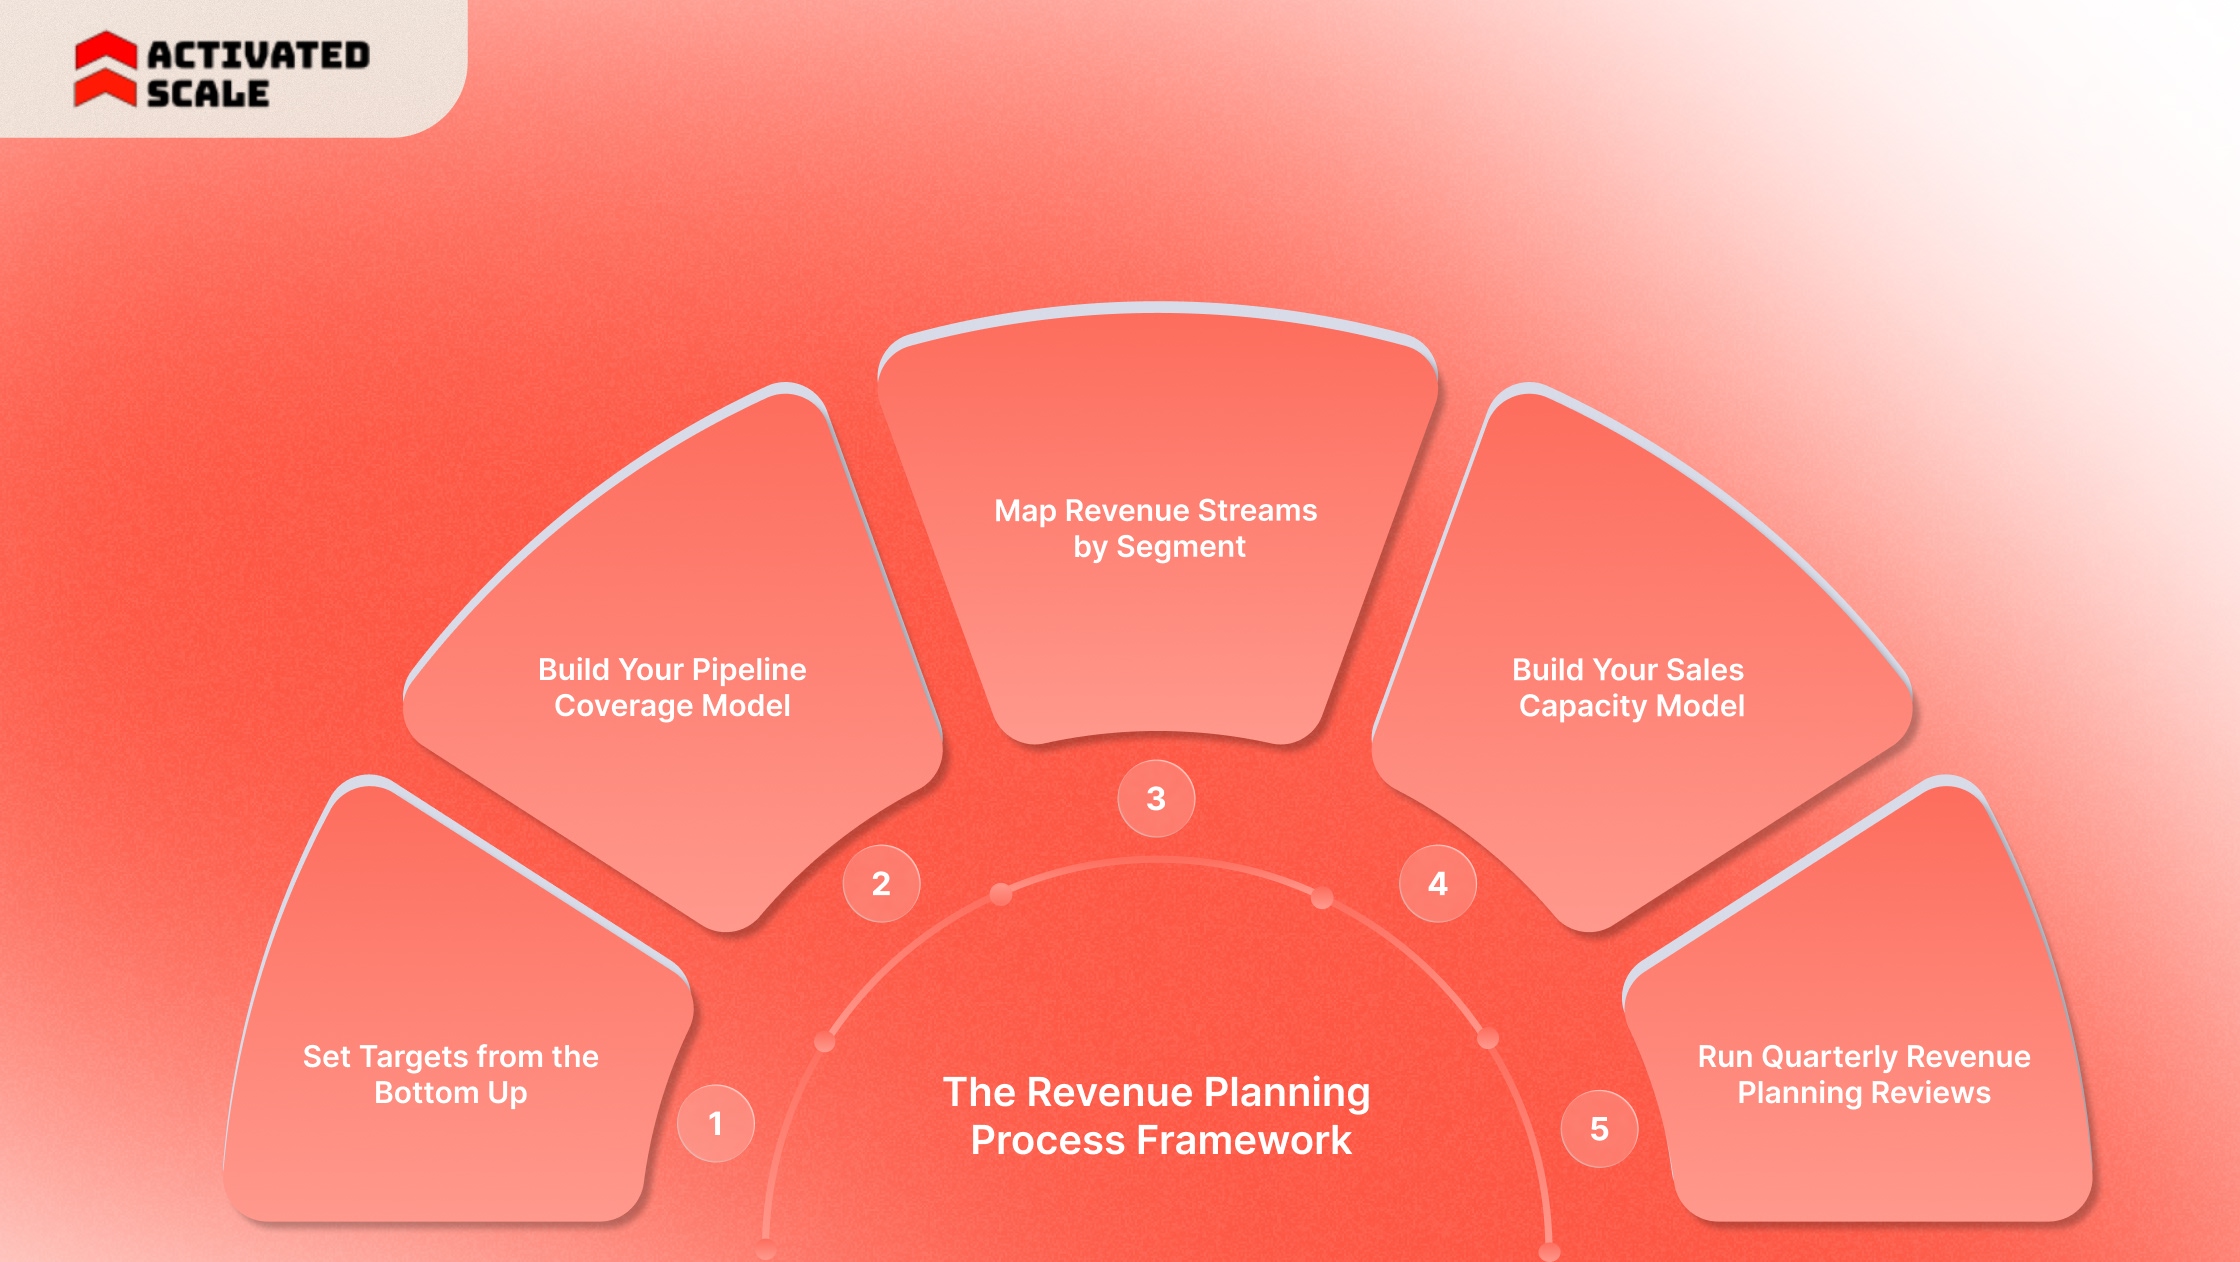
Step 1: Set Targets from the Bottom Up
Most founders start with a top-down number: 'We need $2M this year.' That is a fine starting point. The mistake is stopping there.
Work backwards using your actual sales data:
• What is your current average deal size?
• What is your win rate on qualified opportunities?
• How long is your average sales cycle?
• How many active reps do you have and at what capacity?
This math tells you whether the target is achievable with your current team or whether you need to add headcount, improve conversion, or change your ICP. It forces honesty before the quarter begins.
Step 2: Build Your Pipeline Coverage Model
Once you know your target, calculate what pipeline coverage you need to hit it. Most B2B SaaS teams need a 3x to 5x pipeline coverage ratio, meaning three to five times the revenue target in an active, qualified pipeline.
If your quarterly target is $500K, you need between $1.5M and $2.5M in qualified opportunities. Anything below 2x heading into a quarter is a serious warning sign, regardless of rep confidence.
The coverage model connects your revenue plan to prospecting activity. It tells you how many new pipelines each SDR needs to generate weekly to keep the funnel healthy. That number then drives outreach volume, sequences, and ICP prioritization.
Step 3: Map Revenue Streams by Segment
Not all revenue behaves the same way. Enterprise deals close differently from SMB. Inbound converts at different rates than outbound. New logo revenue ramps slower than expansion from existing accounts.
Here's an example breakdown of key metrics across customer segments, highlighting how they drive your quarterly targets:
This view immediately shows if you are over-indexed on one segment. If enterprise makes up 54% of your quarterly target but carries a 90-day cycle, those deals need to be in your pipeline today, not week eight.
Step 4: Build Your Sales Capacity Model
Revenue targets are only achievable if you have the people and activity to support them. The capacity model answers one question: Do you have enough sellers, at the right volume, to generate the pipeline your target requires?
The inputs you need:
• Current headcount by role: SDRs, AEs, and account managers
• Average ramp time for each role (typically 3 to 6 months for an AE)
• Quota per fully ramped rep
• Current pipeline generation rate per SDR per week
• Attrition assumptions for the planning period
If your capacity math shows a gap between what the current team can produce and what your target requires, that is your hiring trigger. You now have a data-backed reason to bring on an SDR or AE rather than a gut feel.
Step 5: Run Quarterly Revenue Planning Reviews
Quarterly revenue planning is where the annual plan meets reality. Every quarter, you pressure-test your assumptions against what actually happened.
A strong quarterly review covers:
• Actual vs. planned revenue by segment
• Pipeline coverage heading into the next quarter
• Win rate and average deal size trends
• Sales cycle length by segment and any changes from the prior quarter
• Capacity gaps: Do you need to hire before next quarter to hit the number?
• Channel performance: which sources generated the most reliable pipeline?
This is also when you update assumptions. If the average deal size has dropped 15% over two quarters, your coverage model needs to reflect that. Carrying stale assumptions is how plans become fiction.
If your team is still figuring out which numbers to track or how to connect them to a quarterly target, Activated Scale connects startups with fractional VPs of Sales who can walk in and build this structure from day one, without the cost of a full-time hire.
Also Read: Revenue Operations vs Sales Operations Difference
The 6 Metrics That Make a Revenue Planning Process Work
A revenue planning process assessment is only as useful as the metrics feeding it. These six measurements, when tracked consistently, show whether your system is working and where to fix it when it is not.

1. Monthly Recurring Revenue (MRR)
MRR is the normalized monthly revenue generated from all active subscriptions or recurring contracts. It removes billing-cycle noise, so you always see a clear picture of what the business is producing each month.
Formula: Add up all recurring charges billed to active customers in a given month. For a tiered pricing model, sum each tier: (customers on Tier 1 x Tier 1 price) + (customers on Tier 2 x Tier 2 price), and so on.
What to track beyond the raw number:
• New MRR: Revenue added from new customers this month.
• Expansion MRR: Revenue added from existing customers through upsells or seat increases.
• Churned MRR: Revenue lost from cancellations or downgrades.
• Net New MRR: New MRR + Expansion MRR - Churned MRR
Where it connects to planning: MRR tells you the state of the recurring revenue base before you add new deals. If expansion MRR is consistently outpacing churned MRR, your existing customers are a growth engine, not just a retention problem. Aim for 10 to 15% monthly MRR growth at the early stage.
2. Annual Recurring Revenue (ARR)
ARR is MRR multiplied by 12. It smooths out monthly fluctuations and gives you the revenue number that investors, boards, and hiring decisions are typically anchored to.
Formula: ARR = MRR x 12. If your MRR is $83,000, your ARR is $996,000, effectively $1M ARR.
ARR is the number you use when setting annual targets and presenting to investors. According to The SaaS CFO, many Series A investors expect $1.5M to $3M ARR as a baseline before funding. Understanding where you are relative to that threshold shapes both your revenue target and your hiring roadmap.
Where it connects to planning: ARR growth rate indicates whether your revenue plan is compounding. A company growing ARR at 2x to 3x year-over-year with consistent MRR trends has a plan that is working. A company with lumpy ARR and inconsistent MRR has a pipeline problem buried somewhere.
3. Customer Acquisition Cost (CAC)
CAC is the total amount you spend on sales and marketing divided by the number of new customers acquired in the same period.
Formula: CAC = (Total Sales and Marketing Spend) / (Number of New Customers Acquired)
- Example: If you spent $30,000 last quarter on sales salaries, tools, and marketing campaigns, and closed 15 new customers, your CAC is $2,000.
Where it connects to planning: CAC is your variable for hiring decisions. Before bringing on another SDR or AE, you need to know whether your acquisition cost is trending toward sustainability. If CAC is rising quarter-over-quarter while deal size remains flat, scaling the team only exacerbates the problem.
4. Customer Lifetime Value (LTV)
LTV is the total revenue you expect to earn from a customer over the full length of their relationship with your company.
Formula: LTV = Average Revenue Per Customer Per Month x Average Customer Lifespan in Months. A more precise version factors in gross margin: LTV = (ARPU x Gross Margin %) / Monthly Churn Rate.
- Example: If your ARPU is $500/month, gross margin is 75%, and monthly churn is 3%, your LTV is ($500 x 0.75) / 0.03 = $12,500.
Where it connects to planning: LTV tells you how aggressively you can invest in acquisition. If your LTV: CAC ratio is below 3:1, scaling your sales team will burn cash faster than it generates returns. Fix unit economics first, then scale.
5. Win Rate
Win rate is the percentage of qualified sales opportunities that result in a closed-won deal within a given period.
Formula: Win Rate = (Closed-Won Deals / Total Opportunities Entered) x 100
Example: If your team entered 80 opportunities in Q2 and closed 20, your win rate is 25%.
Do not stop at the aggregate number. Segment it by:
• Rep: If one rep closes at 35% and another at 12%, that is a coaching conversation, not a pipeline problem.
• Lead source: If inbound leads close at 40% and outbound at 15%, your pipeline mix needs to shift.
• Segment: Enterprise may close at a lower rate but produce higher deal values. SMB may close faster but carry more churn risk.
Where it connects to planning: Win rate is the denominator in your pipeline coverage calculation. If your win rate drops from 28% to 20%, you now need 40% more pipeline to hit the same target. Revenue plans built on stale win rate assumptions are almost always optimistic.
6. Pipeline Coverage Ratio
Pipeline coverage is the ratio of total qualified pipeline value to your revenue target for a given period.
Formula: Pipeline Coverage = Total Pipeline Value / Revenue Target for the Period
Example: If your Q3 target is $500,000 and you have $1.85M in active, qualified pipeline, your coverage ratio is 3.7x.
Where it connects to planning: Pipeline coverage is the fastest health check in any revenue planning process assessment. You can run it in 30 seconds, and it immediately tells you whether the quarter is on track or already behind.
Also Read: Salary to Revenue Ratio for Salespeople
Where the Revenue Planning Process Breaks Down and How to Fix It?
Most revenue planning failures come from the same handful of mistakes. Knowing them in advance helps you avoid rebuilding the system mid-quarter.

Treating the Annual Plan as a One-Time Document
The plan goes out in Q4, gets shared with the board, and then gets forgotten. Then a rep leaves, a product launch slips, or a segment underperforms. No one updates the plan, so decisions keep getting made on stale assumptions.
- Fix: Build quarterly revenue planning reviews into the calendar as a standing meeting with a structured agenda. Not optional.
Planning Revenue Without Planning Sales Capacity
Revenue targets go up 50%, but no one runs the capacity math. The team stays the same size, maintaining the same pipeline generation rate, while a number that requires 50% more is needed. The gap shows up in week ten.
- Fix: Every revenue plan needs a corresponding capacity model. How many reps do you have? What can they realistically produce, and what is the hiring timeline to close any gap?
Skipping Scenario Planning
Many revenue plans rely on a single projection that assumes pipeline, win rate, and hiring timelines will unfold exactly as expected. In reality, sales performance shifts constantly. Deals slip, conversion rates fluctuate, and hiring delays happen.
According to Gartner, only 45% of sales leaders have high confidence in their forecast accuracy. When teams plan around only one outcome, even small changes can quickly push revenue off track.
Fix: Create at least two planning scenarios before the quarter begins: a base case and a conservative case. Each should adjust key assumptions such as win rate, deal size, or hiring timelines so the team knows how to respond if performance drops.
Example: A simple way to implement this is to model how core assumptions change between the two scenarios.
If win rates start trending toward the conservative scenario mid-quarter, the team already knows the response: increase pipeline generation, adjust targets, or accelerate hiring.
Using Win Rate and Deal Size Averages That Are Months Old
If your win rate dropped from 30% to 22% in Q1 and your Q2 plan still assumes 30%, you are already behind before the quarter starts. The same applies to the average deal size. Markets move. ICP fit changes. Competitive pressure shifts close rates.
- Fix: Refresh your core sales assumptions at the start of every quarterly revenue planning cycle. Do not carry last year's numbers into a different market.
No Connection Between the Plan and ICP or Channel Data
A revenue plan that does not specify which customers you are targeting and through which channels gives your reps nothing actionable to work from. Your SDRs need to know which list to work on. Your AEs need to know which segments get priority.
- Fix: Segment your target by ICP and break down pipeline requirements by channel. Assign coverage expectations by rep. That is when a revenue plan becomes a sales playbook.
Also Read: RevOps Implementation Guide for Startups
How Activated Scale Helps Startups Build a Revenue Planning Process That Sticks?
Activated Scale is a sales talent marketplace that connects U.S.-based startups and scale-ups with vetted, experienced sales professionals on flexible contract-to-hire terms. The platform serves founders and revenue leaders who need experienced sales talent without the cost or commitment of a full-time hire.
Building a revenue planning process is not just a spreadsheet exercise. It requires someone who has done it before, understands your sales motion, and can hold the team accountable to the structure. That is exactly where Activated Scale's talent comes in.
Fractional VPs of Sales Who Build the Revenue Infrastructure
Most early-stage startups are not ready for a full-time VP of Sales. But they are ready for the systems that a VP of Sales installs.
Activated Scale places fractional VPs of Sales who have built GTM motions across industries. They define your ICP, build the capacity model, set pipeline coverage expectations, design the quarterly review cadence, and install the CRM process that makes your data trustworthy.
You get the revenue planning infrastructure without a $250K+ annual salary commitment.
SDRs and AEs Who Execute Within the Plan
A revenue plan is only as good as the pipeline feeding it. If SDRs are not meeting a defined standard or consistently logging in the CRM, the data your plan relies on is unreliable.
Activated Scale connects you with vetted, U.S.-based SDRs and AEs who understand structured sales processes. They operate within the frameworks your leadership defines, which means pipeline data reflects reality rather than wishful thinking.
Flexible Hiring That Matches Your Planning Cycle
One of the hardest parts of implementing revenue planning is timing. You need a headcount in place before the quarter begins, but committing to a full-time hire before validating your assumptions is a financial risk.
Activated Scale's contract-to-hire model lets you bring on experienced talent to test your plan in real conditions so that you scale when the data supports it and not a minute before.
Stop building your revenue plan around hope. Activated Scale gives you access to vetted fractional sales leaders and reps who can build the system, fill the pipeline, and help you hit the number.
Conclusion
Revenue targets do not become results on their own. The space between setting a number and hitting it is filled by the systems, habits, and data disciplines you put in place.
The revenue planning process is that system. It turns a goal into a pipeline model, a pipeline model into a capacity plan, and a capacity plan into a hiring and execution roadmap. Get it right and your quarters become predictable. Skip it, and you spend every month reacting.
If you are ready to start building with real structure, Activated Scale can connect you with the fractional sales talent to make it happen. Book a demo today.
FAQs
1. How often should a revenue plan be updated?
Most companies review revenue plans quarterly and adjust assumptions based on pipeline, conversion rates, and market changes. Frequent reviews help prevent outdated forecasts and missed targets.
2. Who should be responsible for revenue planning in a startup?
Revenue planning is usually led by founders, revenue leaders, or a VP of Sales, with input from finance, marketing, and operations teams to ensure targets align with actual execution capacity.
3. What tools are commonly used for revenue planning?
Startups often use CRM platforms, spreadsheets, and revenue analytics tools to track pipeline, conversion rates, and forecasts. These tools help align sales data with revenue targets.
4. How do startups know if their revenue plan is realistic?
A plan is realistic when it matches pipeline coverage, sales capacity, and historical conversion data. Comparing targets against past performance helps identify unrealistic assumptions early.
5. What is the biggest risk in revenue planning for startups?
The biggest risk is relying on outdated assumptions about win rate, deal size, or pipeline growth. Small changes in these metrics can quickly derail revenue targets.
The Ultimate Guide to Hiring a Salesperson!
Get the step-by-step guide to hiring, onboarding, and ensuring success!