_edi.png)

A scene that plays out in boardrooms everywhere: The pipeline dashboard is green, the team is busy, but when the quarter closes, the revenue isn’t there.
The gap between forecast and reality is highly expensive. Sales leaders are under pressure to explain why projected deals aren't closing, but too often they lack the visibility to diagnose the problem in real time.
The problem runs so deep that only 12% of marketing leaders feel confident their current team setup can deliver revenue targets in the year ahead. This reveals many to plan major structural overhauls. The solution?
Creating better sales analytics. How? In this guide, we'll discuss exactly how this helps leaders move from unproductive decisions to data-backed strategies.
You'll also learn which metrics actually predict outcomes, how to spot revenue risks before they materialize, and how to turn your pipeline data into a reliable forecast.
Key Insights
- 12% of marketing leaders believe their current team structure can meet revenue targets.
- 44% of leaders cite poor data quality as a major obstacle to analytics success.
- 41% of executives believe dashboards support decision-making effectively.
- The four main types of sales analytics include descriptive, diagnostic, predictive, and prescriptive analysis.
- Core metrics include revenue growth, pipeline value, win rate, sales cycle length, and customer acquisition cost.
What is Sales Analytics?
Sales teams collect thousands of data points every week. Activity logs, deal stages, and conversion rates all reveal signals about pipeline health.
Sales analytics refers to the practice of analyzing sales data to understand performance patterns and revenue trends. The goal involves identifying what drives wins, losses, and pipeline movement.
However, the goal remains unattained for many reasons. When leaders were asked what holds back analytics success, nearly (44%) cited poor data quality as a major roadblock.
So, your goal is not only to find better analytics but to build one that could put your goals into action.
Sales Analytics vs Sales Reporting vs Sales Intelligence
Sales teams often mix these terms during pipeline discussions. The confusion creates reporting systems that show numbers but fail to explain revenue behavior.
Leaders need to know which approach answers which question. The table below clarifies how each function supports revenue visibility and decision-making.
Sales leaders search analytics instead of reporting or intelligence since the term covers performance analysis and decision guidance in one discipline.
Once leaders understand that structure, one question usually follows: What specific types of analysis help translate those patterns into action?
Read Also: How a BDR Playbook Fuels Startup Growth
The Four Pillars of Sales Analytics: A Breakdown
Why is that deal stuck? Which opportunities are truly at risk? And what will revenue actually look like next quarter?

To answer those questions, leaders need the right type of analysis. Each category of sales analytics serves a distinct purpose as follows:
1. Descriptive Analytics
Descriptive analytics explains what happened in the sales pipeline. Leaders review historical data to track revenue performance, deal volumes, and conversion rates.
Dashboards summarize these patterns through reports and charts. Examples include revenue growth trends, deal counts, and average deal size.
2. Diagnostic Analytics
Diagnostic analytics explains why specific outcomes occurred. Sales leaders analyze conversion rates, stage progression, and pipeline drop-offs to find causes behind revenue changes.
Diagnostic insights often reveal weak qualifications or long proposal cycles.
3. Predictive Analytics
Predictive analytics estimates future revenue outcomes. Models analyze historical pipeline data, deal velocity, and win rates to forecast future performance.
Sales teams use these projections during quarterly pipeline reviews and revenue planning.
4. Prescriptive Analytics
Prescriptive analytics recommends actions that improve sales outcomes. Advanced models evaluate pipeline signals and buyer engagement patterns to suggest next steps for sales teams.
These insights help sales leaders prioritize high-probability opportunities and improve conversion performance.
Many organizations identify revenue gaps but lack the right sales talent to address them quickly. Activated Scale helps revenue teams close those gaps with U.S.-based sales professionals ready to contribute immediately.
Explore the Fractional Selling service to access experienced Account Executives (AEs) who strengthen pipeline generation without adding full-time headcount.
Since we've covered what each type of sales analytics does, that leaves one final question unanswered: What difference does it actually make?
Why Sales Analytics Matters For You
The theory is useful. But let's be honest: You don't need another framework, but what you need is answers.
You need your team to spend less time updating spreadsheets and more time selling. That's exactly what sales analytics delivers.
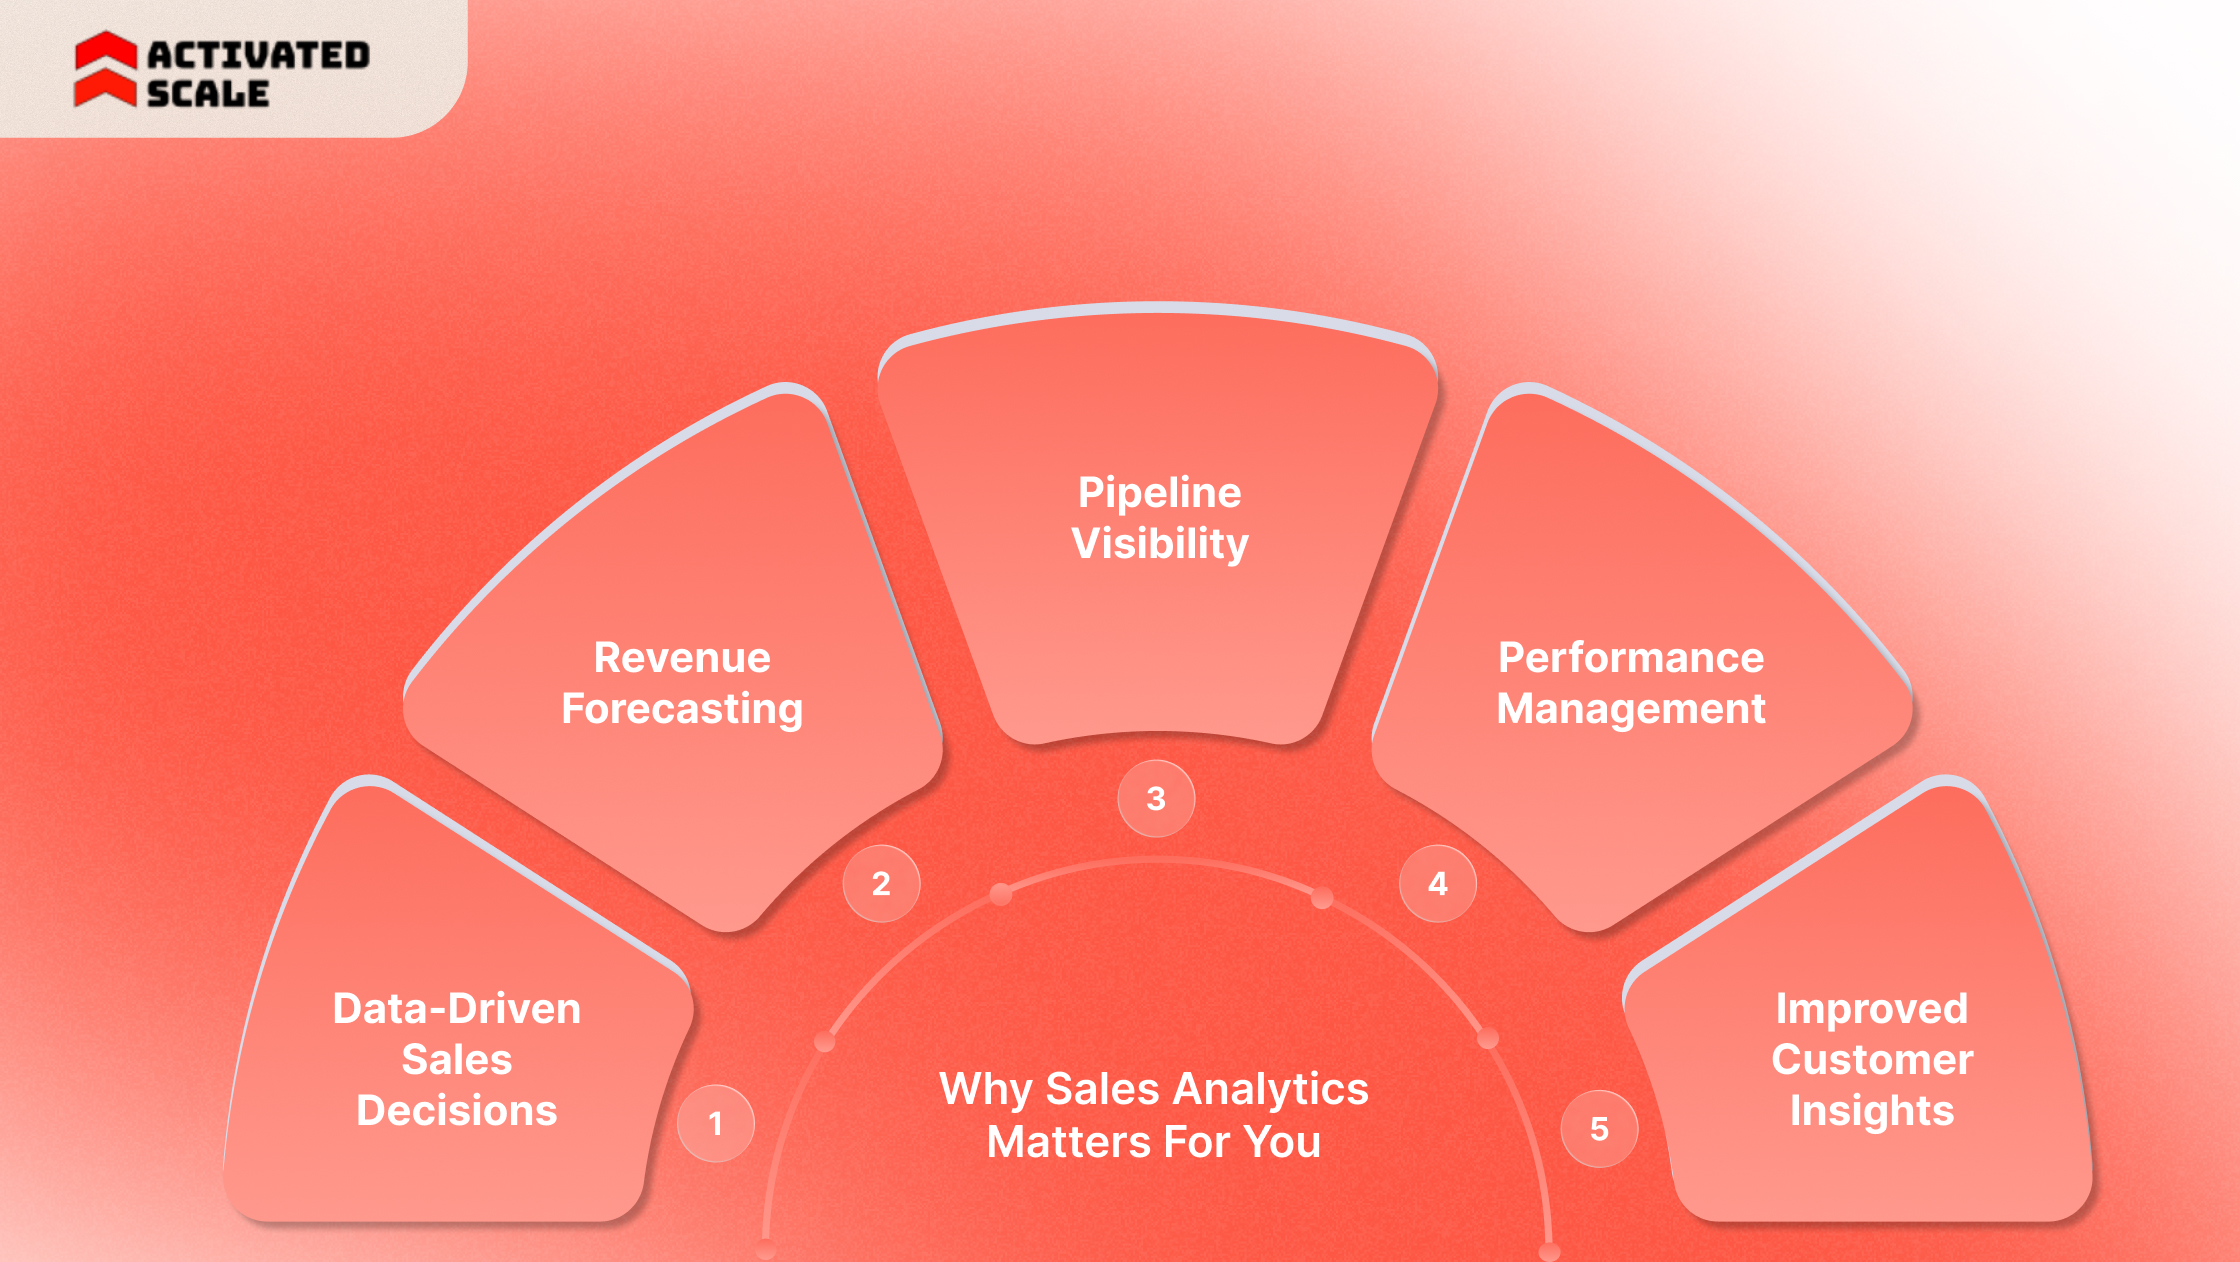
Here are the 5 benefits of sales analytics:
1. Data-Driven Sales Decisions
Sales teams collect large volumes of CRM activity data every week. Raw data alone rarely reveals what actions improve deal outcomes.
You can examine conversion patterns and engagement signals to guide strategic decisions.
2. Revenue Forecasting
Forecast accuracy remains one of the hardest challenges for revenue leaders. Small errors in pipeline assumptions can create large gaps in quarterly projections.
It analyzes historical pipeline behavior, win rates, and deal progression.
3. Pipeline Visibility
Revenue teams often lose deals inside unclear pipeline stages. Leaders see opportunities in the pipeline but cannot easily explain progression patterns.
Sales analytics reveals deal movement trends.
4. Performance Management
Sales performance varies across teams and individuals. Activity metrics alone rarely explain those differences.
This evaluates deal outcomes, engagement signals, and conversion rates across representatives.
5. Improved Customer Insights
Customer buying patterns often reveal strong signals about future revenue opportunities.
It helps teams analyze purchasing trends, deal size patterns, and engagement signals. These insights support stronger account planning and expansion strategies.
41% of executives only believe their current dashboards effectively support business decision-making, leaving the majority navigating with incomplete visibility.
For that, you need some specific key metrics to measure whether your analytics will share the right result.
Also Read: Building an Effective SDR Training Program: Powerful Tips & Online Courses
9 Key Sales Analytics Metrics to Track
You open your dashboard and find dozens of metrics. By the time you scroll to the bottom, you're not sure which numbers actually matter.
Sales analytics solves that problem by narrowing the field to measurable indicators that drive decisions. These metrics reveal whether your pipeline is healthy, your deals are moving, and your revenue goals are within reach.
Below are nine essential metrics to start tracking from now on:
Revenue Metrics
Revenue indicators reveal growth patterns and deal value trends.
- Total revenue: It measures the value of all closed deals during a specific period. This metric shows overall sales performance and revenue contribution.
- Revenue growth rate: This compares the revenue between two periods. Leaders use this metric to evaluate growth momentum and market expansion.
- Average deal size: It shows the typical value of closed deals. This metric helps leaders understand how pricing, packaging, or targeting affects revenue outcomes.
Pipeline Metrics
Pipeline indicators reveal how deals move through the sales process.
- Pipeline value: This represents the total potential revenue from open opportunities. Leaders use this metric to estimate future revenue potential.
- Sales cycle length: It measures the time required to move a deal from first contact to close. Long cycles often signal friction in the sales process.
- Lead-to-opportunity conversion rate: This metric tracks the percentage of leads that become qualified opportunities. Strong conversion rates often reflect effective targeting and qualification.
Performance Metrics
Performance indicators measure individual and team productivity.
- Win rate: This measures the percentage of opportunities that convert into closed deals. Leaders use this metric to evaluate sales effectiveness.
- Quota attainment: It measures how frequently representatives meet or exceed revenue targets. This metric highlights high-performing teams and coaching opportunities.
Customer Metrics
Customer indicators reveal the long-term value of acquired accounts.
- Customer acquisition cost (CAC): It is the cost required to acquire a new customer. Sales analytics compares CAC with revenue to evaluate profitability.
Strong sales analytics reveals conversion weaknesses. Fixing those gaps often requires the right sales capacity at the right moment.
Explore Activated Scale's Fractional Sales Leadership service to help revenue teams fill those gaps with U.S.-based sales professionals.
Somewhere between your CRM and your weekly pipeline review, the data needs to be collected, sorted, and turned into something useful. That's the part people usually skip over.
How Does Sales Analytics Work Today?
There's no shortage of sales data, so the CRM fills up. The hard part? Figuring out what any of it means. That takes structure.

Here's how sales analytics delivers it in four stages:
Step 1: Data Collection
CRM platforms track opportunity values and account records. Marketing platforms capture lead engagement and campaign responses. Product platforms reveal usage patterns and expansion signals.
Example:
A SaaS company collects deal stage data from Salesforce, marketing lead activity from HubSpot, and product adoption data from the product analytics platform.
Step 2: Data Processing
Data processing organizes and cleans these records so analysis becomes reliable. Teams structure datasets around pipeline stages, revenue categories, and account attributes.
Example:
Pipeline data from Salesforce may contain inconsistent stage labels. Processing standardizes these stages so leaders can track deal progression accurately.
Step 3: Data Analysis
Sales analytics tools evaluate deal velocity, conversion rates, and engagement trends. Dashboards, statistical models, and machine learning algorithms help identify patterns across large datasets.
Common platforms include:
- CRM analytics tools, such as Salesforce analytics dashboards
- Business intelligence tools such as Tableau and Power BI
Example:
A BI dashboard in Power BI analyzes pipeline conversion rates and highlights stages where deals frequently stall.
Step 4: Actionable Insights
The final stage converts analysis into practical decisions.
Sales leaders adjust pipeline strategy, resource allocation, or sales coaching based on insights from sales analytics.
Example:
Analytics reveals low conversion between the proposal and close stages. Leaders introduce improved pricing discussions and negotiation training to improve win rates.
Revenue teams still depend on the right tools to support this process. The choice of platform often determines how quickly leaders can detect pipeline risk or revenue opportunities.
Read Also: What is Lead Generation: Sales or Marketing?
5 Features to Look for in a Sales Analytics Tool
Ever sat through a sales tool demo where everything looks amazing, but something feels off? You're not alone.
The trick is knowing what to look for before you start shopping. Here are five features that separate useful tools from overhyped ones:
1. Clear Data Visualization
Sales leaders review performance data quickly during revenue meetings. Visual formats such as charts, trend lines, and comparison graphs make patterns easier to understand.
2.Direct CRM Connectivity
Customer relationship management systems store most of the information required for sales analytics. Integration with CRM platforms improves data consistency and reduces manual reporting work.
3. Insight Beyond Raw Numbers
Sales teams benefit from insights that explain patterns, not only data points. Platforms that highlight deal risk, conversion trends, or engagement signals help leaders interpret pipeline behavior faster.
4. A Single View of Revenue Signals
Sales professionals work across multiple systems throughout the day. Switching between platforms slows decision-making.
A consolidated dashboard brings revenue indicators and key opportunities into one view.
5. AI-Supported Opportunity Analysis
Advanced tools analyze historical sales behavior and engagement signals to highlight promising opportunities.
AI capabilities inside platforms can suggest priority accounts and simulate how pipeline changes may influence revenue outcomes.
Activated Scale connects revenue teams with sales reps who can translate analytics insights into pipeline growth. Explore the Contract-to-Hire Sales Recruiting service to bring the right talent into your team on a flexible basis before committing to full-time hiring.
Final Thoughts
You have the data and the dashboards. What you need is the Return On Investment (ROI). Sales analytics helps you find the gaps, and fixing them is where revenue actually happens.
That's why Activated Scale exists. We connect you with experienced, best sales talent who can step into those gaps immediately and start driving results.
Our services deliver just revenue-ready professionals who know how to execute. Book a call now to start turning sales insight into income.
FAQs
1. How often should sales analytics dashboards be reviewed?
Sales leaders typically review sales analytics dashboards weekly during pipeline meetings. Forecast models and revenue projections are often updated monthly or quarterly, depending on deal cycles.
2. What skills are required to implement sales analytics successfully?
Effective sales analytics programs require CRM management, data analysis, and revenue operations expertise. Many organizations involve RevOps teams to manage data quality and reporting frameworks.
3. What challenges commonly affect sales analytics adoption?
Three issues appear frequently: Inconsistent CRM data, fragmented systems, and poor adoption among sales teams. Clean data and structured reporting processes improve analytics accuracy.
4. How do startups benefit from sales analytics?
Startups use sales analytics to understand early pipeline patterns, refine qualification criteria, and improve forecasting before scaling the sales team.
The Ultimate Guide to Hiring a Salesperson!
Get the step-by-step guide to hiring, onboarding, and ensuring success!