_edi.png)

You know the dreaded feeling: the quarter is closing, but your pipeline feels like a house of cards. Deals mysteriously stall, reps are optimistic while you’re skeptical, and your projection is not a data-driven prediction.
This is a result of weak pipeline integrity. 63% of companies like yours prioritize their sales pipelines. However, many deals are still stuck, and you have no clear system for understanding why.
Is it a pricing objection, a product gap, or a rep skill issue? Without these insights, you can't intervene effectively.
In this article, we move beyond generic tips. We’ll show you how to start sales pipeline analysis to align sales capacity with a statistically probable chance to close.
Key Takeaways
- A well-structured sales pipeline turns chaos into clarity, helping you track, manage, and close deals faster.
- Key metrics like win rates, deal progression, and SQL-to-opportunity conversion are the backbone of effective pipeline analysis.
- Tracking sales pipeline stages helps optimize the flow, ensuring consistent deal movement toward closure.
- Technology tools like CRMs and platforms like Forecastio give real-time insights, making your pipeline analysis data-driven.
- Optimizing your pipeline with the right tools and strategies leads to higher conversions and a stronger sales team.
What is Sales Pipeline Analysis?
To succeed, you need a clear view of your sales pipeline, with each opportunity, deal, and stage mapped out and easily accessible. That’s the magic of a sales pipeline analysis.
It’s a visual, structured representation of the opportunities moving through different stages of your sales process. It helps pinpoint challenges, refine sales tactics, and predict revenue growth with greater accuracy.
Without it, you risk losing sight of key opportunities in your pipeline.
So, what are the common stages a pipeline should have? Because knowing what a pipeline is and why it's powerful is only the first step.
The key to predictable revenue lies in mastering how it works. This means breaking down the journey every deal takes, from first touch to closed-won.
Read Also: Sales Pipeline Templates for Improved Tracking
Common Sales Pipeline Stages: Know Where Your Deals Stand
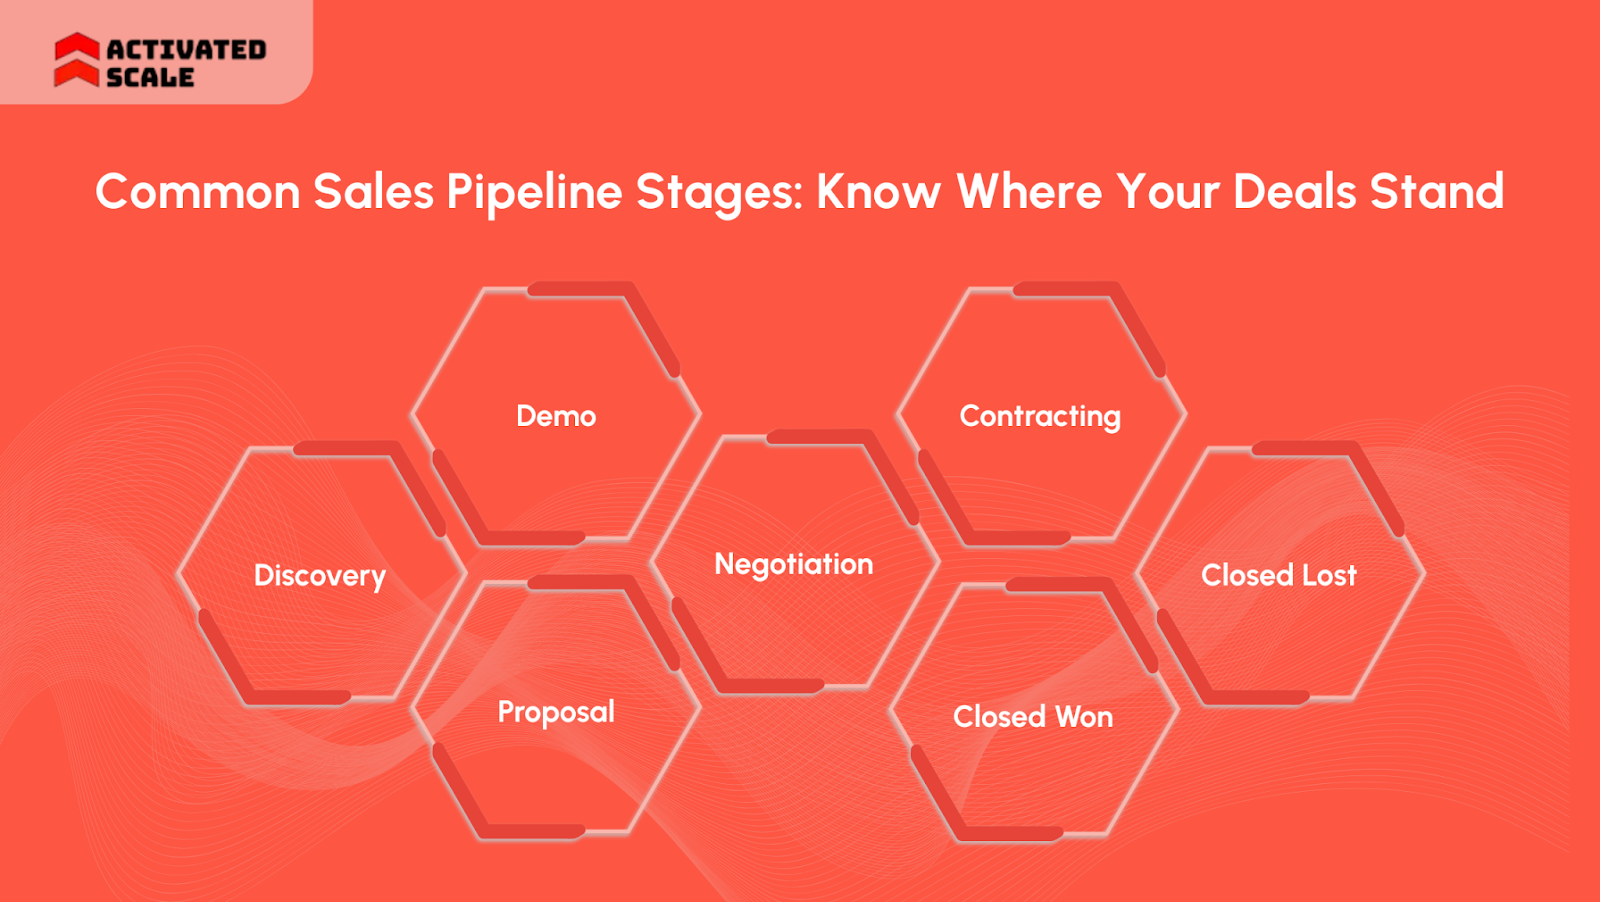
Tracking the stages of your sales pipeline is like following a map on the journey to a closed deal. Each stage offers insights into where a deal stands, and understanding these stages is essential for effective pipeline management.
The typical sales pipeline stages include:
- Discovery: This is the first point of contact. It is where you assess if a lead fits your ideal customer profile and uncover their pain points, needs, and budget.
- Demo: A demonstration of your product or service, designed to show how it can solve the lead’s pain points.
- Proposal: Presenting a customized solution that outlines pricing, features, and ROI expectations, getting closer to a formal agreement. In fact, organizations can get a 25% increase in deal size with the right selling approach or proposal.
- Negotiation: Where terms are discussed, pricing is adjusted, and any final concerns are addressed.
- Contracting: Finalizing legal details and preparing for implementation.
- Closed Won: The deal is signed, and the lead becomes a customer.
- Closed Lost: Deals that didn’t close, with insights into why they didn’t, such as pricing, competition, or timing issues.
Need help refining your sales pipeline? Hire the experts from Activated Scale’s Contract-to-Hire Sales Recruiting services who can close more deals.
While defining your pipeline stages provides structure, it's only through rigorous analysis that you can disclose its true potential.
Tracking key performance metrics actually changes guesswork into certainty. It answers critical questions: Are deals progressing or plateauing? Where are we losing momentum?
20 Key Metrics to Track for Sales Pipeline Analysis
If defining stages is your pipeline's blueprint, then metrics are its diagnostic tools. Without them, you're managing in the dark. This is where specific, purposeful metrics come in to block conversion leaks to sales velocity challenges.
Let's examine the critical metrics you need to track and how each one contributes to a more efficient sales process:
Daily Metrics

1. SQLs Added (Sales Qualified Leads)
Formula: SQLs Added = Total Number of Sales Qualified Leads
How it Helps:
SQLs are leads that have shown strong interest and are considered more likely to convert. Tracking how many SQLs are added daily helps maintain a steady inflow of quality prospects into your pipeline. It ensures you never run out of viable opportunities.
2. Follow-Ups Completed
Formula: Follow-Ups Completed = Total Follow-Ups Done
How It Helps:
Follow-ups are essential for keeping leads engaged. The more follow-ups you complete, the higher your chances of converting leads into opportunities. This metric also reflects how effectively your sales team is nurturing relationships and maintaining momentum.
3. Activity Rate per Sales Rep
Formula: Activity Rate per Rep = Total Activities by Rep/ Total Sales Reps
How It Helps:
This metric measures the consistency and effort across your team. If certain reps are outpacing others, it might indicate top performers or an issue with the team's overall engagement. Tracking activity ensures all reps are contributing equally to the sales process.
4. Response Time to Leads
Formula: Response Time = Total Time to Respond to Lead/ Total Number of Leads
How It Helps:
Quick responses to inbound leads are proven to increase conversion rates. This metric highlights how swiftly your team engages with potential customers. It also helps you identify areas where response times can be improved.
Need to fill your sales pipeline with quality leads quickly? Activate your team with the Fractional Sales Leadership service from Activated Scale to hire Senior Development Representatives (SDRs). They can handle the daily grind of lead qualification and follow-ups.
Weekly Metrics
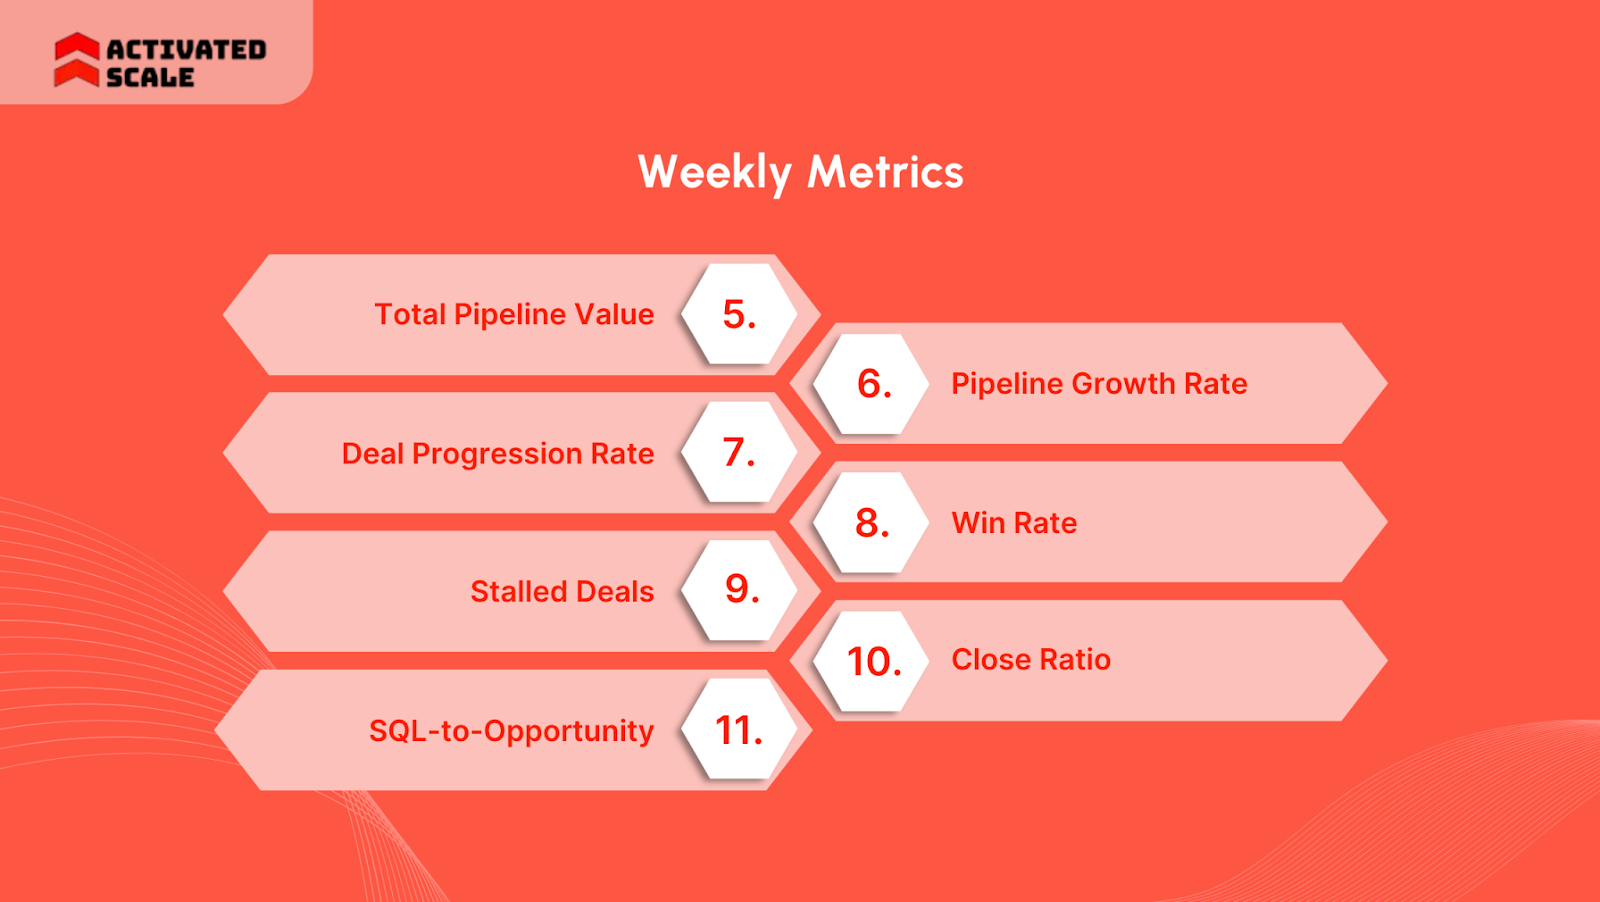
5. Total Pipeline Value
Formula: Total Pipeline Value = ∑(Deal Value of Each Opportunity)
How It Helps:
The total value of your pipeline helps forecast potential revenue. You can assess whether the value of opportunities aligns with your sales targets. Afterward, you can decide if your pipeline is strong enough to meet your goals.
6. Pipeline Growth Rate
Formula: Pipeline Growth Rate = ((Current Pipeline Value−Previous Pipeline Value)/ Previous Pipeline Value)×100
How It Helps:
This metric helps track the expansion or contraction of your pipeline over time. A growth rate that's too slow could signal that you're not generating enough new opportunities.
7. Deal Progression Rate
Formula: Deal Progression Rate = Deals Advancing to Next Stage/ Total Deals in Current Stage
How It Helps:
This metric helps measure the efficiency of deal movement through your pipeline. A high progression rate indicates that your sales process is efficient. On the other hand, a low rate might suggest bottlenecks or issues in your sales tactics.
8. Win Rate
Formula: Win Rate = (Deals Closed Won/Total Deals Closed)×100
How It Helps:
This indicates how successful your team is in closing deals. Tracking win rates helps pinpoint areas for improvement. From lead qualification to negotiation tactics, it can also highlight how well your sales reps perform.
9. Stalled Deals
Formula: Stalled Deals = Deals Not Moving for X Days/ Total Deals in Stage
How It Helps:
Stalled deals are those that have stopped progressing through the sales stages. Identifying stalled deals helps sales managers focus on leads that need additional attention or requalification.
10. Close Ratio
Formula: Close Ratio = (Closed Deals/ Total Opportunities in Pipeline)×100
How It Helps:
This metric is a clear indicator of how effectively your team is converting opportunities into customers. A low close ratio might indicate problems in your sales process or sales strategies.
11. SQL-to-Opportunity Conversion Rate
Formula: SQL-to-Opportunity Conversion Rate = (SQLs Converted to Opportunities/Total SQLs)×100
How It Helps:
This tracks how well your team is turning qualified leads into actual sales opportunities. It provides a measure of your lead qualification process and overall pipeline health.
Struggling to track deal progression effectively? With Activated Scale’s Contract-to-Hire Sales Recruiting service, hire sales professionals who excel at tracking deals through your pipeline.
Monthly Metrics
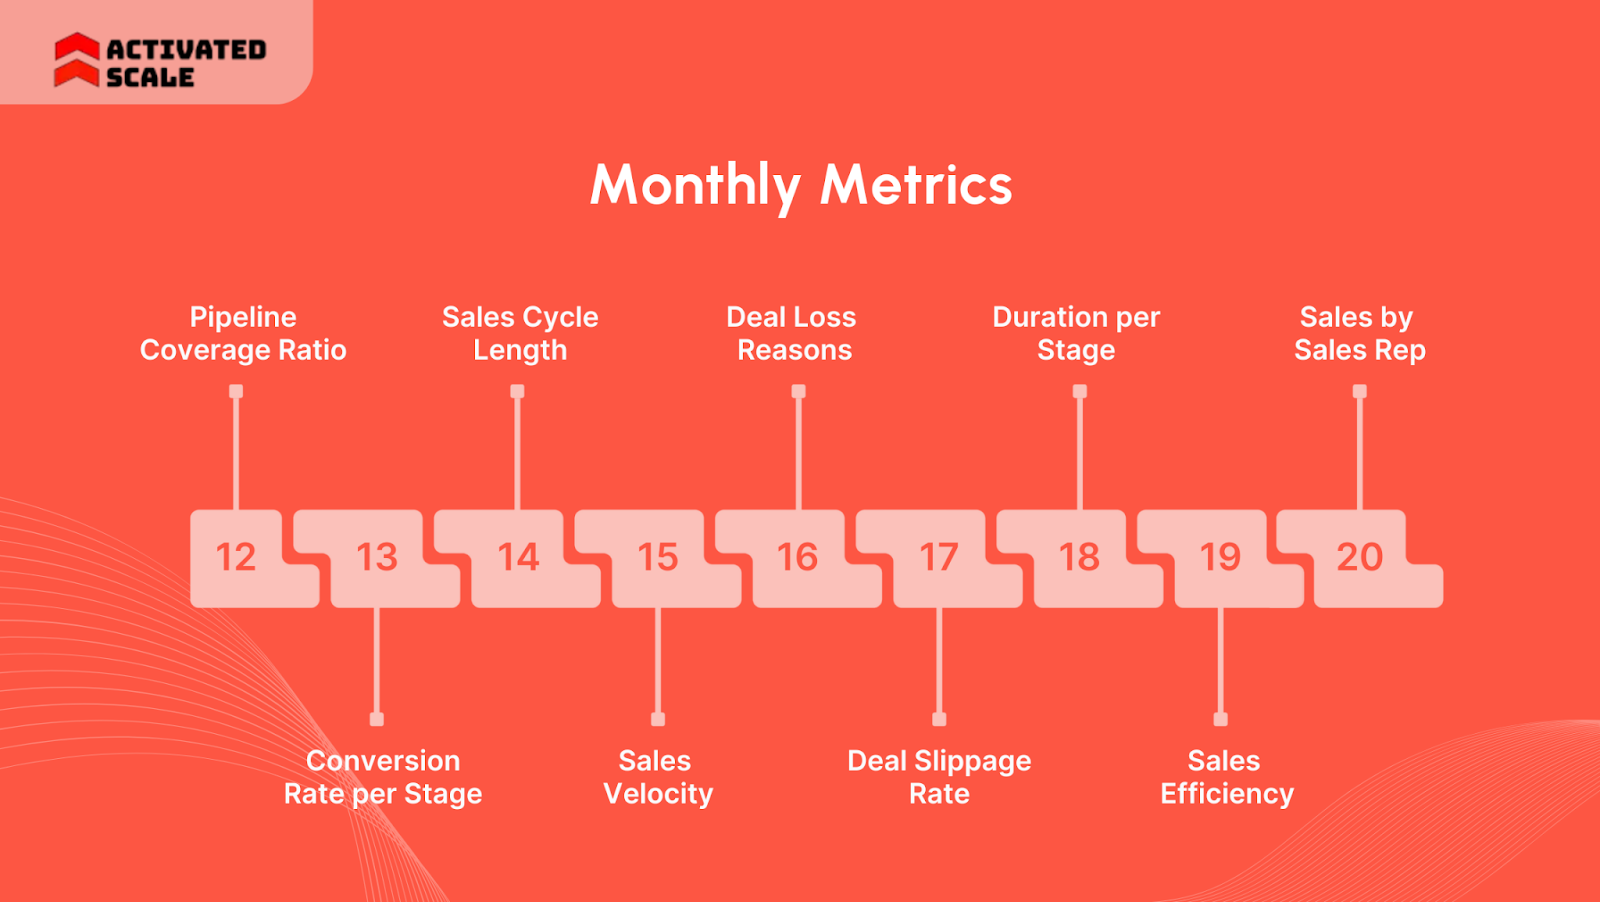
12. Pipeline Coverage Ratio
Formula: Pipeline Coverage Ratio=Total Pipeline Value/ Sales Target
How It Helps: This ratio compares the value of your pipeline against your sales target. A ratio under 1.0 could indicate that you're not generating enough opportunities to meet your goals.
13. Conversion Rate per Stage
Formula: Conversion Rate per Stage = (Deals Moving to Next Stage/ Total Deals in Current Stage)×100
How It Helps:
Identifying weak conversion rates at specific stages can reveal bottlenecks and help you refine your process. This metric allows you to focus on improving specific parts of your pipeline.
14. Sales Cycle Length
Formula: Sales Cycle Length=Total Time from Lead to Close/ Total Number of Deals
How It Helps:
The average sales cycle length helps you track how long it typically takes to close a deal. Reducing the cycle length can increase overall sales efficiency.
15. Sales Velocity
Formula: Sales Velocity= (Number of Deals×Average Deal Value×Win Rate) /Sales Cycle Length
How It Helps:
Sales velocity measures how quickly deals move through your pipeline and generate revenue. It’s a key indicator of the efficiency of your sales process.
16. Deal Loss Reasons
Formula: Deal Loss Rate = (Deals Lost due to X Reason) /Total Deals Lost
How It Helps:
Tracking why deals are lost, whether due to pricing, competition, or timing, can help you adjust and improve future conversions.
17. Deal Slippage Rate
Formula: Deal Slippage Rate = (Deals Delayed beyond Expected Close Date/ Total Deals)×100
How It Helps:
This tracks deals that slip into later periods than expected. High deal slippage can be a sign of problems in the closing process or internal misalignment.
18. Duration per Stage
Formula: Duration per Stage = Time Spent in Each Stage/ Total Deals in Stage
How It Helps:
Tracking how long deals spend in each stage can highlight bottlenecks. Identifying stages where deals are taking too long helps you address inefficiencies.
19. Sales Efficiency
Formula: Sales Efficiency = Revenue Generated/ Total Sales Cost
How It Helps:
Sales efficiency tells you how well your sales efforts are paying off. A high sales efficiency ratio indicates that your team is generating significant revenue relative to the cost of the sales process.
20. Sales by Sales Rep
Formula: Sales per Rep=Total Sales Generated by Rep/ Number of Reps
How It Helps:
This metric identifies top performers and those needing support. It allows you to provide targeted coaching and make strategic decisions about team composition.
Want to get a clear view of your sales performance and scale effectively? Use the Fractional Selling service from Activated Scale to develop strategies that align with your monthly metrics.
Once you get an understanding of these metrics, your next goal should be conducting a sales pipeline analysis. But how to do it like a pro leader? Find your answer in the next section!
6 Steps to Master Sales Pipeline Analysis
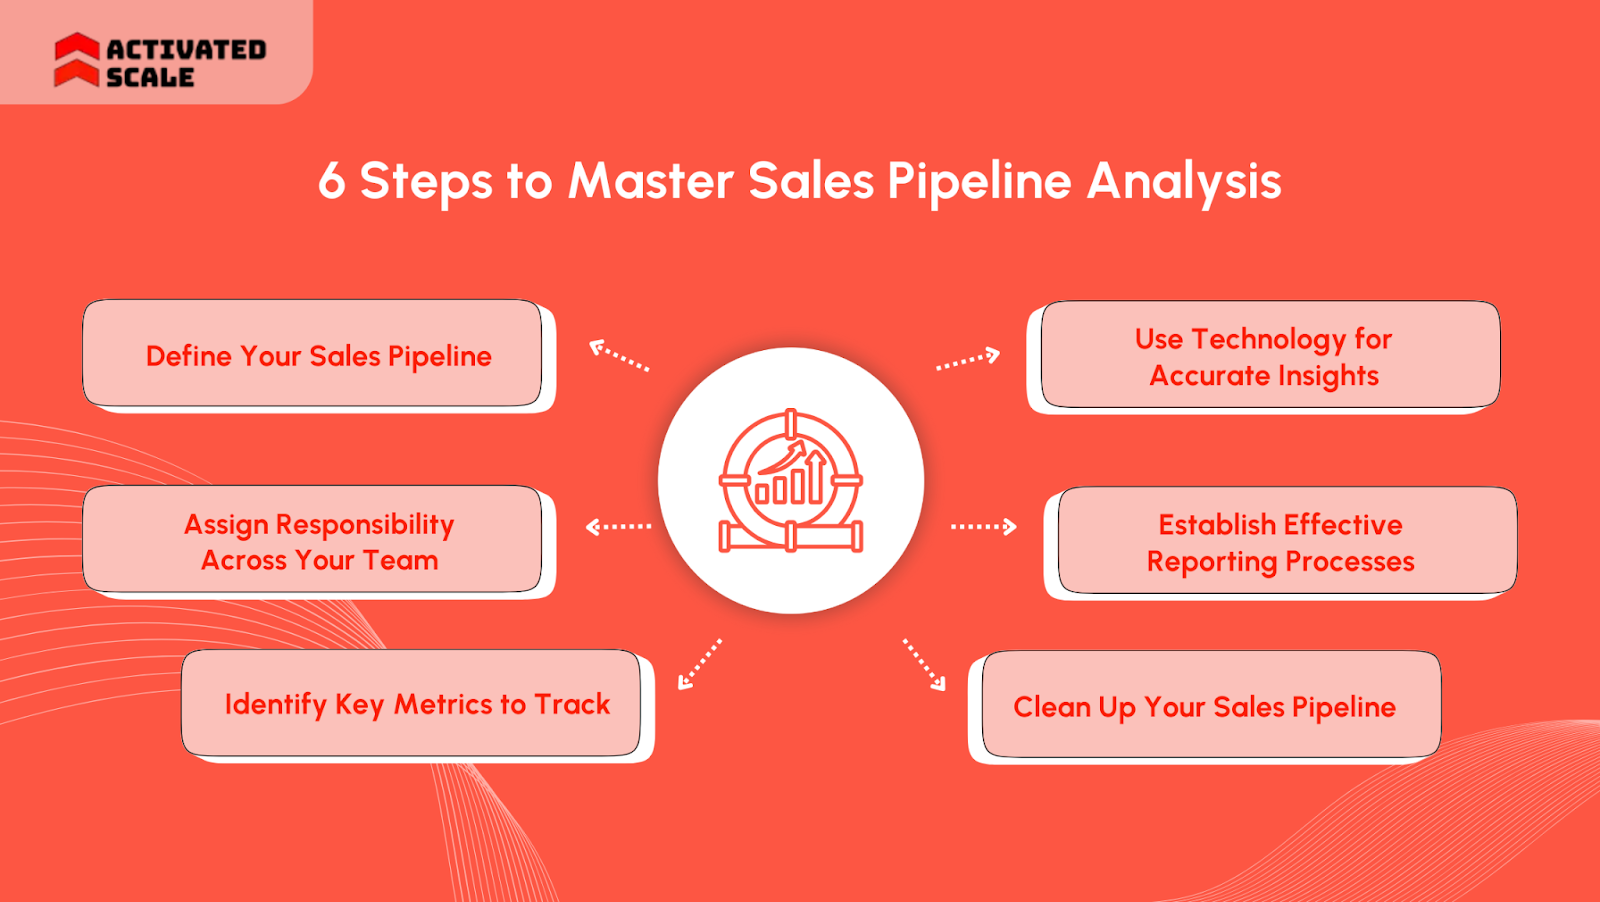
While many teams get stuck in a cycle of frantic quarter-end pushes, top performers rely on a disciplined, repeatable process. They analyze it with precision. The solution should be a structured approach for pipeline analysis.
Follow these six proven steps to build a predictable path to hitting your targets:
Step 1: Define Your Sales Pipeline
Mapping out your sales pipeline is the first critical step in any sales pipeline analysis. Document the stages, people, tools, and tactics involved, and you gain clarity on how deals move from lead to closed.
A well-structured pipeline is key to understanding where inefficiencies may arise.
Tools:
- CRM Systems (e.g., Salesforce, HubSpot): CRMs track each lead’s journey and ensure that the pipeline remains organized and up-to-date.
- Trello or Monday.com: These project management tools help visualize pipeline stages, assign tasks, and monitor progress.
Step 2: Assign Responsibility Across Your Team
Clear responsibility assignment ensures that everyone knows their role in the pipeline analysis. Accountability ensures that issues are addressed promptly at each stage of the process.
Basically, a sales enablement process can help you achieve a 49% higher win rate on projected deals.
Tools:
- Asana or Jira: Project management tools like Asana or Jira ensure that tasks are clearly delegated, tracked, and completed on time.
- Slack: Slack channels dedicated to pipeline performance keep communication clear and ensure accountability.
Step 3: Identify Key Metrics to Track
Metrics act as your sales pipeline’s handling system, and these provide key insights into performance and opportunities for improvement. Identifying which metrics matter most is the foundation of meaningful pipeline analysis. Metrics discussed above are sufficient to fill your pipeline.
Tools:
- Google Analytics: It can track website activity that feeds into lead generation, offering insights into initial pipeline performance.
- Tableau or Power BI: These data visualization platforms provide in-depth reporting and real-time insights into sales metrics.
Step 4: Use Technology for Accurate Insights
Technology plays a vital role in organizing pipeline analysis. CRM and revenue management platforms collect real-time data and offer predictive insights.
Tool:
- Forecastio: This platform offers advanced trend analysis and predictive insights, ensuring your team is always prepared for the future.
Step 5: Establish Effective Reporting Processes
Reporting processes are the backbone of successful pipeline analysis. Formalizing how reports are generated ensures that insights translate into real-world actions that improve sales performance.
Tools:
- Google Data Studio or Tableau: Both of these reporting tools help visualize pipeline data and present it in an actionable format for easy decision-making.
- Salesforce Analytics Cloud: Salesforce provides customizable reporting tools that help sales leaders track pipeline health to adjust strategies accordingly.
Step 6: Clean Up Your Sales Pipeline
A clean pipeline is crucial for maintaining focus on high-potential leads. Regularly reviewing your pipeline to remove stagnant leads.
Cold leads should be followed up with or removed if they show no engagement. This keeps your sales process efficient and prevents wasted time on unproductive opportunities.
Tools:
- CRM Systems (e.g., Salesforce, HubSpot): To identify stagnant leads and update contact information.
- Email Automation Tools (e.g., Mailchimp, ActiveCampaign): For automated follow-ups with cold leads.
- Pipeline Management Tools (e.g., Trello, Monday.com): To streamline and review your pipeline stages.
So, you can change your sales pipeline into a powerful engine once you implement these steps.
Read Also: Importance and Benefits of Sales Pipeline Management: A Guide
Final Thoughts
Many leaders track their pipeline, but few truly understand it. The difference between activity and achievement lies in the strategic analysis. This ability to diagnose why deals stall and pinpoint where your process is leaking revenue is key to optimizing sales performance.
Mastering this analysis changes your pipeline from a passive report into an active blueprint for sustainable business growth.
Activated Scale lets you hire the expert sales leaders you need to build, guide, and help your team, fractionally or full-time. Book a call today to turn your pipeline potential into measurable performance.
FAQs
1. What is a Sales Pipeline Analysis Template, and How Can It Help?
A sales pipeline analysis template provides a structured format for tracking each stage of your sales process. It helps sales teams identify challenges, predict revenue, and measure performance.
2. Can You Share a Sales Pipeline Analysis Example for Better Understanding?
A sales pipeline analysis example showcases how a typical sales process moves from lead generation to closed deals. It includes key metrics like deal progression rate, win rate, and pipeline value. This helps teams visualize where improvements are needed and assess overall sales effectiveness.
3. How Do I Create a Sales Pipeline Analysis PDF for My Team?
A Sales Pipeline Analysis PDF can be created by consolidating pipeline data, key metrics, and performance insights into a downloadable document. This allows for easy sharing and reviewing, enabling sales teams to track progress and align strategies across departments.
4. What Is a Sales Pipeline Dashboard, and How Does It Improve Pipeline Performance?
A sales pipeline dashboard is a real-time visual tool that displays key metrics, stages, and overall sales progress. It enables sales managers to quickly assess pipeline health, monitor team performance, and make data-driven decisions.
The Ultimate Guide to Hiring a Salesperson!
Get the step-by-step guide to hiring, onboarding, and ensuring success!