_edi.png)
“Another quarter’s over. Did your sales team hit quota?”
“Not exactly… but we made a ton of calls and sent hundreds of emails.”
If this above conversation sounds painfully familiar, you’re not alone. Many sales leaders track dozens of numbers, yet still miss the real signals of growth. Effort is high, but results are unpredictable.
A structured sales forecasting guide shouldn’t take more than eight to 12 weeks to create. Yet, many organizations do not put in the effort to create one. So, the sales reps don’t know what to measure and what to expect.
In this guide, we’ll reveal the cutting-edge sales performance metrics that actually drive results. You’ll learn how to calculate them and turn numbers into actions that move your business forward.
Key Takeaways
- Align your metrics with current business goals and sales maturity.
- Balance activity, pipeline, outcome, and efficiency measures for a complete view.
- Use metrics to guide coaching, training, and resource allocation.
- Review data regularly and act fast on trends; don’t just report them.
- Metrics are the compass, but execution is the journey.
What are Sales Performance Metrics?
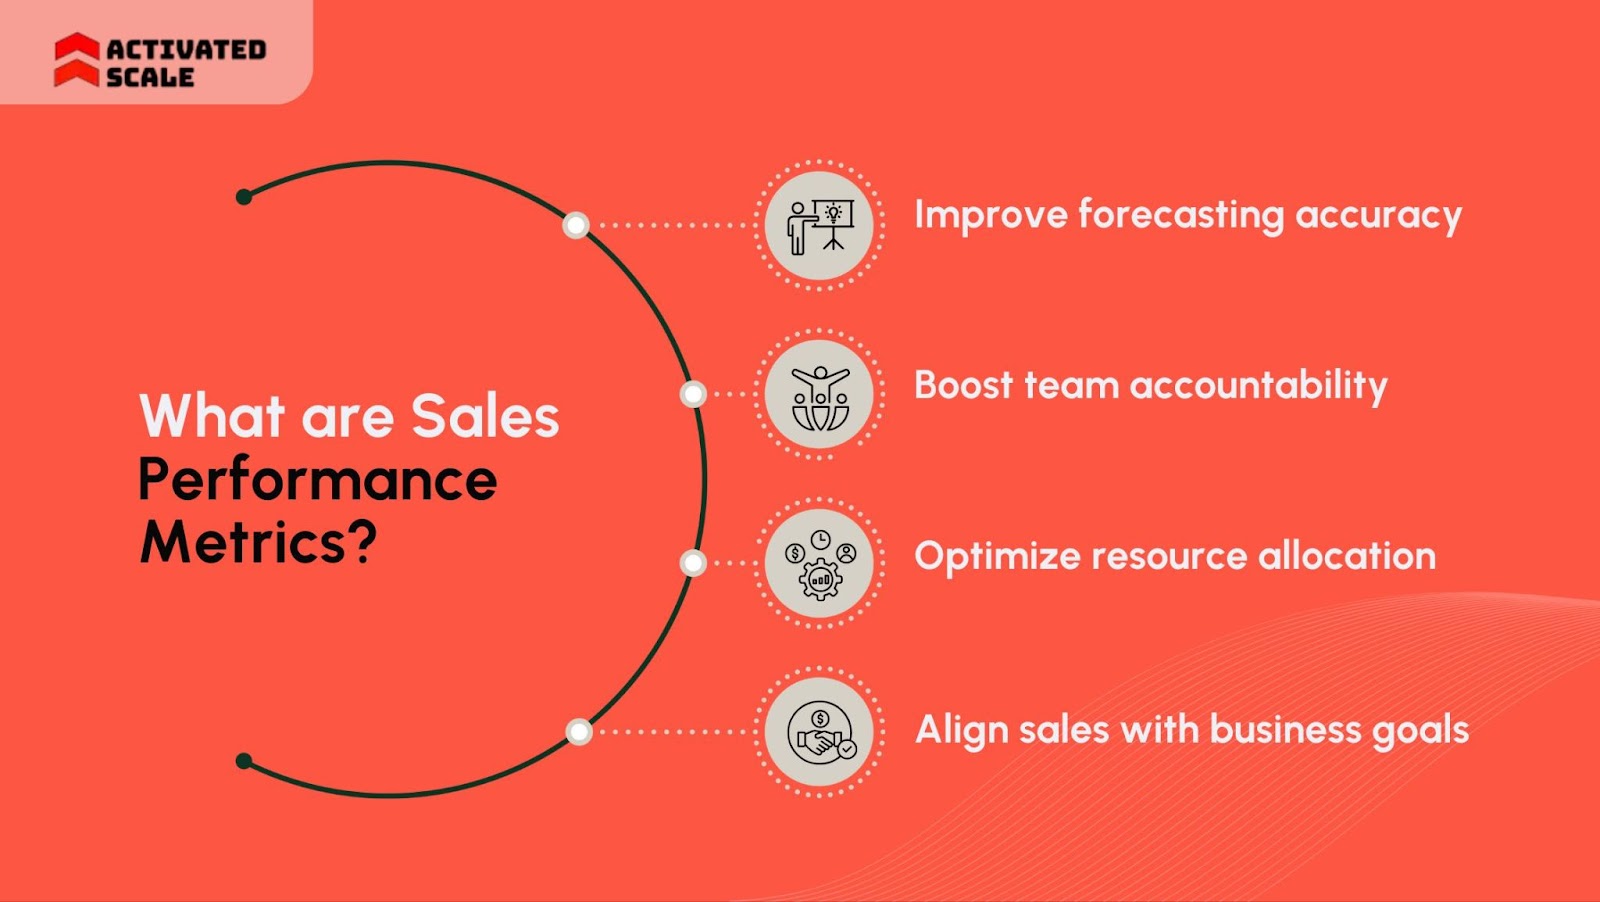
Think of sales performance metrics as the scoreboard for your revenue engine. They’re measurable data points that tell you how well your sales activities, processes, and people are performing.
Unlike broad business KPIs, sales performance metrics zoom in on the actions specific to your sales team. They cover everything from the number of discovery calls booked to the percentage of deals closed.
This provides a detailed view of where your process is effective and where it’s not.
Here’s why they matter:
- Improve forecasting accuracy: When you know your historical win rates and sales cycle lengths, you can project future revenue with confidence.
- Boost team accountability: Clear metrics keep everyone aligned on goals. Reps see how managers know where to focus coaching.
- Optimize resource allocation: Data helps determine whether to double down on a high-converting channel or provide training to improve closing skills.
- Align sales with business goals: Metrics tie day-to-day activities to the bigger picture, ensuring every effort supports revenue.
So, if you use sales metrics correctly, they change data into actions. But how will you measure that?
Now comes the practical part, figuring out which ones to track so you can focus on generating the revenue.
Read Also: Sales KPIs: Essential Metrics to Track for Sales Teams
18 Key Cutting-edge Sales Performance Metrics You Should Track
Not all metrics deserve your time. Some are feel-good stats that look great in reports but do nothing to improve results. The 18 metrics below are different.
They offer clear insight, measurable impact, and direct actions you can take to improve performance. Here’s a list of essential KPIs:
Activity Metrics
Activity metrics reveal the intensity and consistency of your outreach efforts. Calls, emails, and meetings might seem like simple tallies. However, in reality, they’re the frontline indicators of pipeline health.
If these numbers dip, it’s often a warning light long before revenue takes a hit. If you track them with precision, you can optimize rep productivity so that every sales day moves the needle forward.
1. Number of Calls Made
Definition: The total count of outbound sales calls made by your team in a specific time period. For outbound-driven teams, calls are often the first step in pipeline generation. Low call volume can choke your pipeline before it even starts.
Formula: Simple count from CRM or call tracking software.
Detailed insight
- A high call number means little if your connect rate is low.
- Track both the quantity and quality metrics like talk time, prospect engagement, and follow-up actions.
- Compared across reps, are top performers making more calls, or just better ones?
2. Emails Sent
Definition: The number of outbound sales emails sent during a given period.
Email marketing remains a scalable, trackable way to open conversations, follow up, and nurture prospects. However, over-reliance without personalization can lead to a decline in response rates.
Formula: Email volume from CRM/email automation tools.
Detailed insight
- Track response rate alongside send volume to spot diminishing returns.
- Measure follow-up cadence, most conversions happen after the 3rd–5th touch, not the first.
- High volume + low engagement signals bad targeting or poor messaging.
3. Meetings Scheduled
Definition: The total number of confirmed sales meetings, demos, or discovery calls booked. Meetings are the bridge between outreach and closing. A dip here often predicts a weak pipeline in the coming weeks.
Formula: Confirmed meetings in CRM or scheduling tool (Calendly, Chili Piper, HubSpot Meetings).
Detailed insight
- Track the meeting-to-opportunity conversion rate to judge lead quality.
- Identify no-show patterns, certain times, days, or reps might have higher drop-offs.
- Look at the source of meetings: are they inbound, outbound, or referrals?
Your activity metrics won’t improve without the right people making the calls and sending the emails. With Activated Scale’s Contract-to-Hire Sales Recruiting, you can test-drive vetted SDRs and AEs before committing full-time.
Pipeline Metrics
Pipeline metrics are the vital signs of your sales process. They reveal how much potential revenue is in play, how efficiently deals progress, and where momentum stalls.
Sales leaders can predict revenue, balance workloads, and fine-tune resource allocation with confidence.
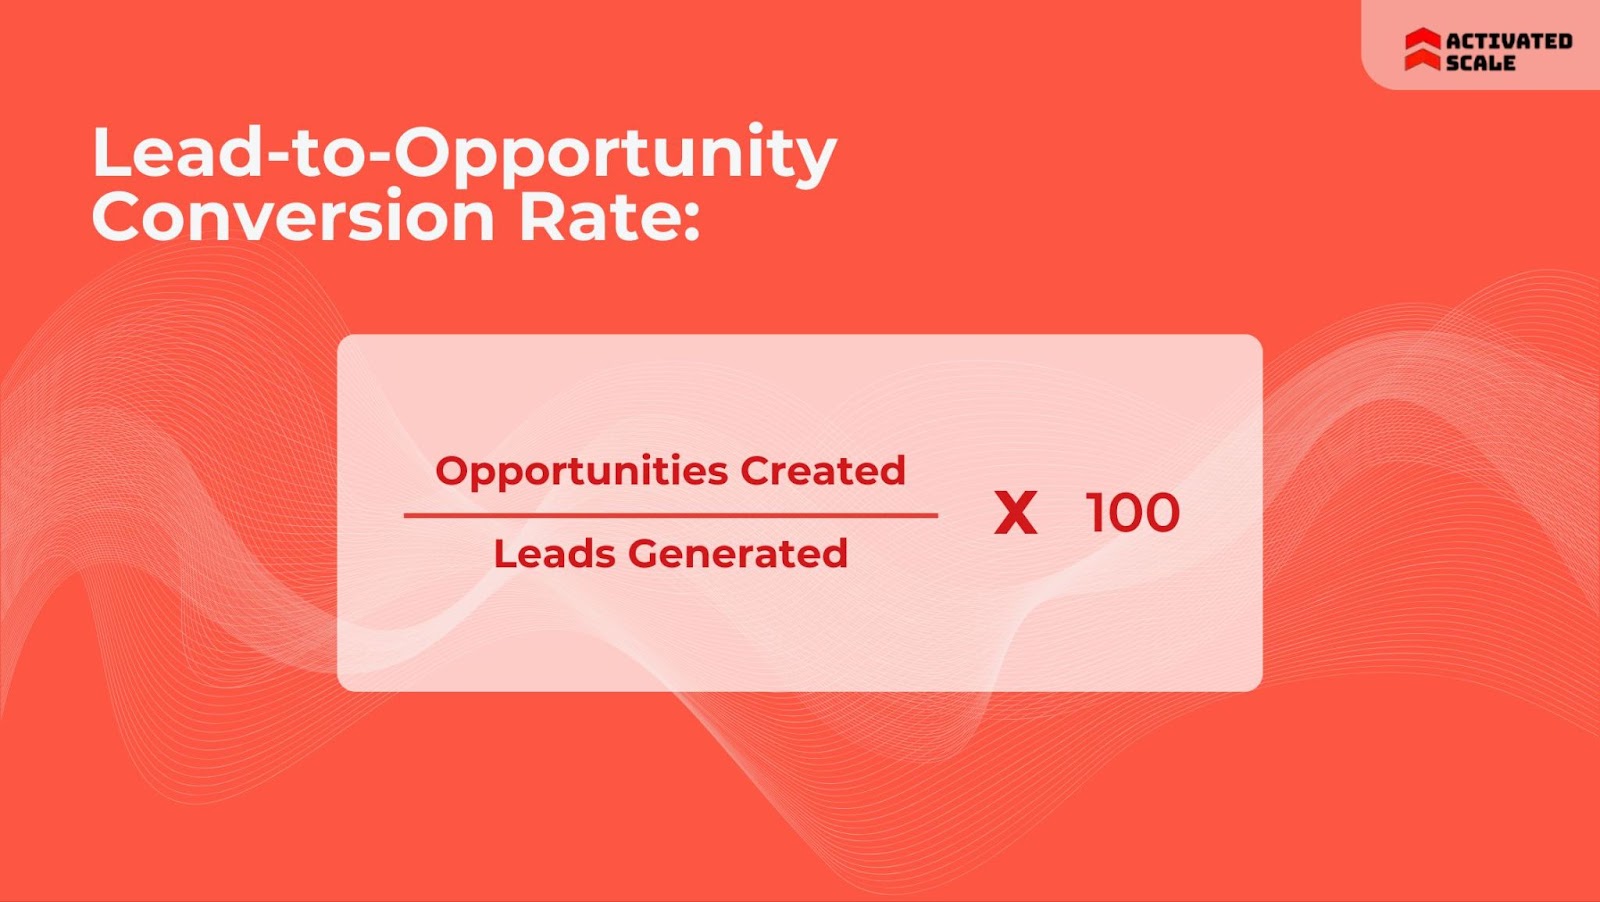
4. Lead-to-Opportunity Conversion Rate
Definition: Percentage of leads that progress to the opportunity stage in your sales pipeline. Shows the quality of leads and effectiveness of early-stage sales efforts.
Formula: Lead-to-Opportunity Conversion Rate = (Opportunities Created/ Leads Generated)*100
Insights:
- Low rates may signal poor targeting or lead quality.
- Review the Ideal Customer Profile (ICP) and lead sources.
- Improve discovery calls and qualification scripts.
5. Opportunity-to-Close Conversion Rate
Definition: Percentage of opportunities that turn into closed deals. A direct revenue driver, small gains here have a significant impact.
Formula: Opportunity-to-Close Rate = (Closed-Won Deals/ Total Opportunities)*100
Insights:
- Low rates suggest issues with proposals or negotiations.
- Strengthen competitive positioning.
- Conduct regular deal reviews for stuck opportunities.
6. Average Deal Size
Definition: Average revenue per closed deal. It helps predict revenue and set realistic rep targets. For example, in 2025, the average deal size hits $544 million globally.
Formula: Average Deal Size = Total Revenue from Closed Deals/ Number of Closed Deals
Insights:
- Target higher-value accounts to grow deal size.
- Offer bundles or premium packages.
- Train reps in value-based selling.
7. Sales Cycle Length
Definition: Average number of days from first contact to deal closure. A shorter cycle accelerates cash flow; longer cycles slow growth.
Formula: Sales Cycle Length = Sum of Deal Close Durations/ Number of Deals Closed
Insights:
- Long cycles often come from approval bottlenecks.
- Simplify proposals to reduce decision delays.
- Help reps make closing decisions faster.
8. Pipeline Coverage Ratio
Definition: Ratio of total pipeline value to the sales target for a period. It indicates whether you have enough opportunities to hit the quota.
Formula: Pipeline Coverage Ratio =Total Pipeline Value/ Sales Target
Insights:
- Aim for 3–4× pipeline coverage over your quota.
- If coverage is high but closes are low, check deal quality.
- Avoid overfilling with unqualified leads.
A pipeline without consistent, quality opportunities is just a spreadsheet. Activated Scale’s Fractional Selling service gives you on-demand sales reps who know how to fill your pipeline.
Outcome Metrics
Outcome metrics are where effort meets results. They cut through the noise of daily activities and reveal the actual business impact.
Think of them as your sales scoreboard. No matter how busy the team looks, these numbers tell you if you’re truly winning. Tracking them ensures every strategy ties back to tangible business growth.
9. Win Rate
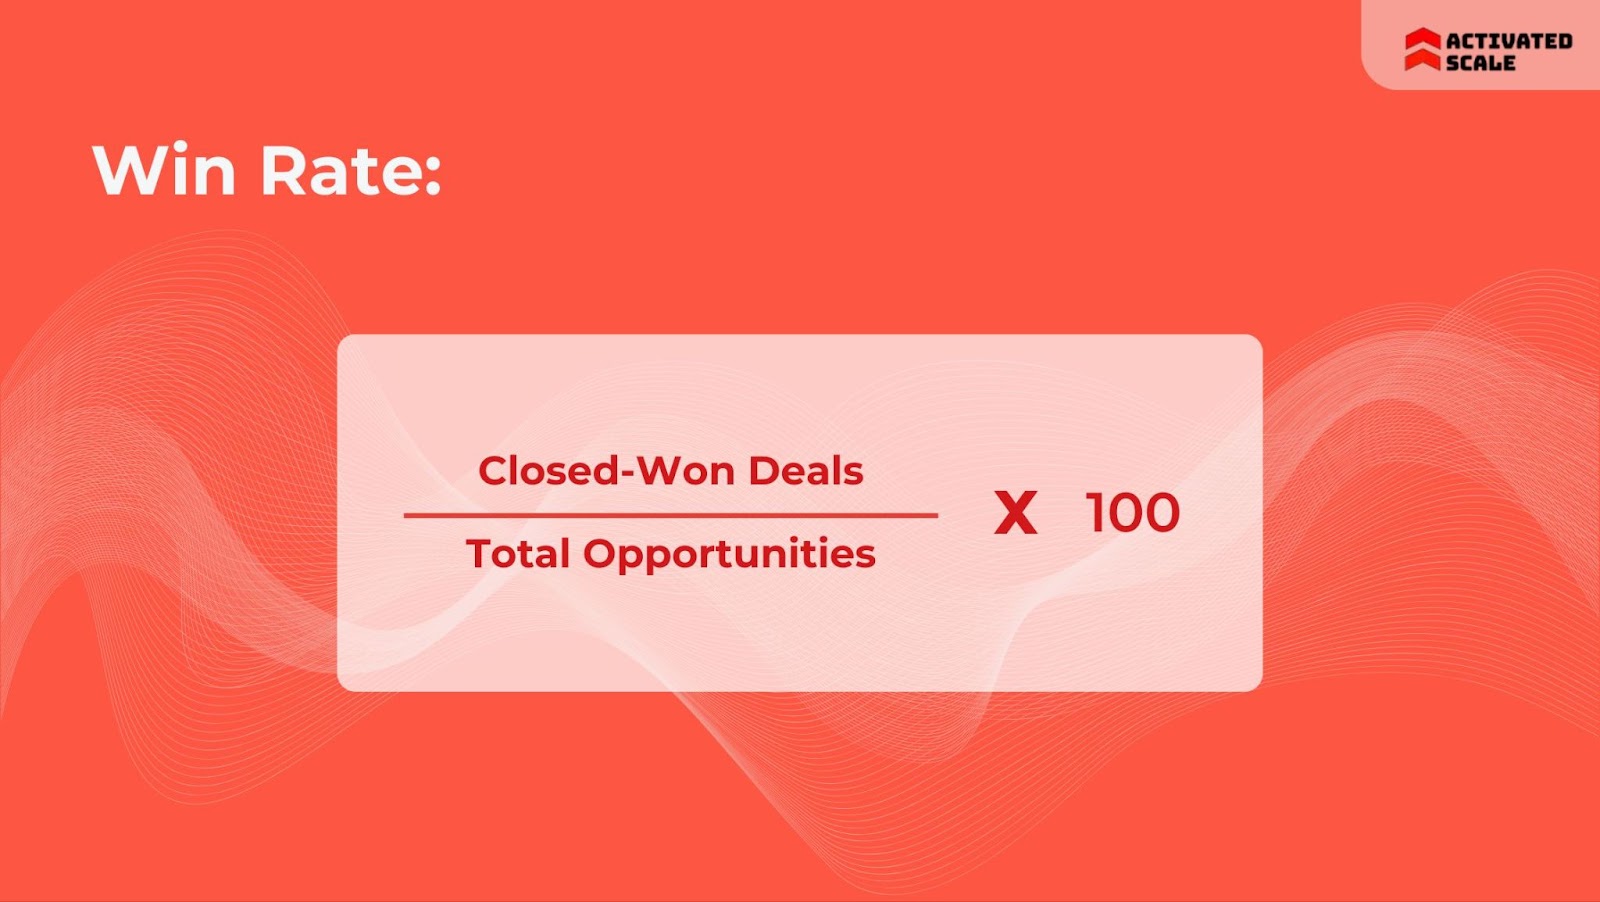
Definition: Percentage of total opportunities that result in a closed-won deal. It measures overall sales effectiveness and competitiveness.
Formula: Win Rate = Closed-Won Deals/ Total Opportunities×100
Insights:
- An average sales win rate is 21%. A lower rate than that suggests issues with qualification or closing skills.
- Improve pitch alignment with buyer pain points.
- Use post-mortems on lost deals to identify patterns.
10 . Customer Acquisition Cost (CAC)
Definition: Total cost of acquiring a new customer, including marketing and sales spend. This indicates the efficiency of your sales and marketing investments.
Formula: CAC = (Total Sales + Marketing Costs)/ Number of New Customers Acquired
Insights:
- Rising CAC may mean inefficient lead channels.
- Invest more in the channels with the lowest CAC.
- Automate repetitive outreach to lower costs.
11. Customer Lifetime Value (CLV)
Definition: Predicted total revenue from a customer over their entire relationship with your company. It helps evaluate the long-term profitability of customer segments. A good CLV typically ranges from $127 to $462.
Formula: CLV = Average Purchase Value×Purchase Frequency×Customer Lifespan
Insights:
- Increase CLV through upselling, cross-selling, and retention programs.
- Focus marketing on high-CLV segments.
- Monitor churn to protect long-term revenue streams.
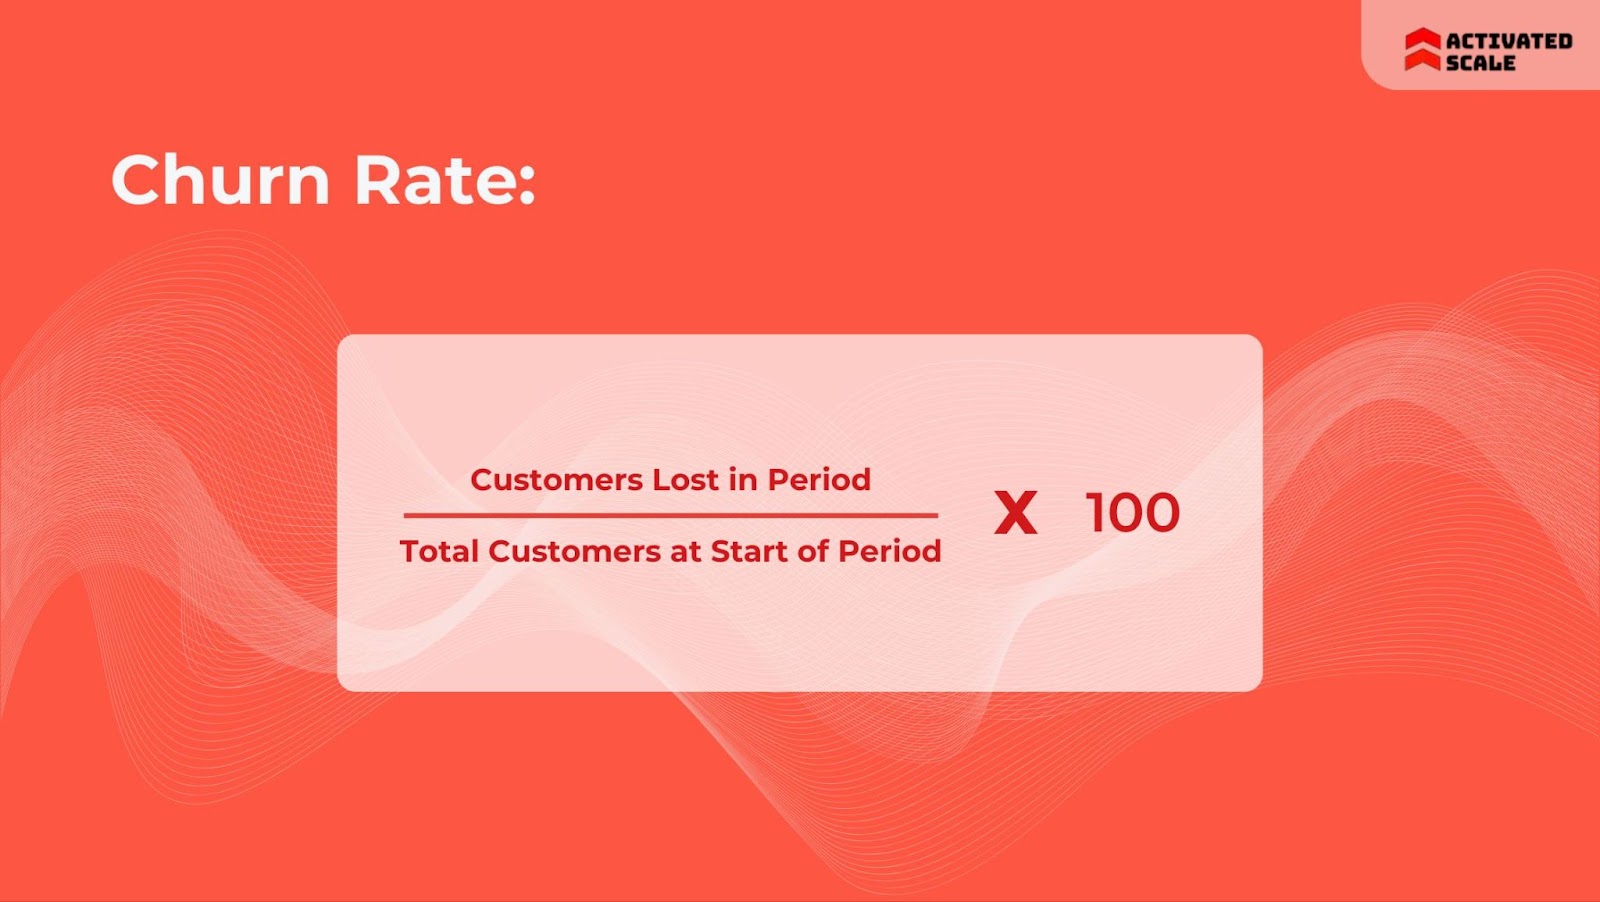
12 .Churn Rate
Definition: Percentage of customers lost during a given period. Its importance is that high churn undermines growth and increases CAC pressure.
Formula: Churn Rate = (Customers Lost in Period/Total Customers at Start of Period)×100
Insights:
- Identify churn triggers through exit interviews.
- Offer loyalty or win-back programs.
- Monitor the onboarding experience, as most churn happens early.
13. Quota Attainment
Definition: Percentage of sales reps meeting or exceeding their sales quota. A direct reflection of team performance and goal-setting accuracy.
Formula: Quota Attainment = (Reps Hitting Quota/ Total Reps) ×100
Insights:
- Low attainment across the team may mean unrealistic quotas.
- Review territory distribution and lead quality.
- Provide targeted coaching to underperformers.
Efficiency Metrics
Efficiency metrics focus on output vs. effort. They don’t just tell you what you achieved but how smartly you achieved it. With limited resources, these numbers reveal if you’re squeezing maximum value from every dollar.
Uncover where productivity soars and where challenges are quietly eating into revenue potential.
14. Revenue per Sales Rep
Definition: Average revenue generated by each sales representative over a given period. This highlights individual productivity and helps set realistic benchmarks.
Formula: Revenue per Rep=Total Revenue/ Number of Sales Reps
Insights:
- Low figures may point to training gaps or poor lead distribution.
- Reward top performers to boost morale.
- Compare across teams or regions to spot trends.
15. Sales per Territory
Definition: Total sales generated within a specific geographic or assigned territory. This shows the revenue potential and performance of different markets.
Formula: Sales per Territory=Total Revenue in Territory/ Number of Territories
Insights:
- Disparities may indicate uneven market opportunities.
- Reallocate high-potential accounts to balance workload.
- Customize local strategies to cultural or market differences.
16. Upsell/Cross-sell Rate
Definition: Percentage of existing customers who purchase additional or related products. It can measure the effectiveness of customer relationship management.
Formula: Upsell/Cross-sell Rate = Number of Customers with Additional Purchases/ Total Customers×100
Insights:
- Strong rates indicate good trust and product-market fit.
- Train reps on value-based selling techniques.
- Bundle offerings to encourage multi-product adoption.
17. Average Revenue per Account (ARPA)
Definition: Average revenue earned from each customer account. It assesses account profitability and sets growth targets.
Formula: ARPA = Total Revenue/ Number of Accounts
Insights:
- Low ARPA may mean underutilized accounts.
- Focus on expanding account usage through customized solutions.
- Use tiered pricing to encourage higher spend.
18. Forecast Accuracy
Definition: How closely predicted sales match actual sales. It also affects budgeting, hiring, and inventory decisions.
Formula: Forecast Accuracy= (1−(Actual Sales−Forecasted Sales)/Actual Sales)×100
Insights:
- Low accuracy disrupts resource planning.
- Improve by using historical data plus current market signals.
- Keep feedback loops between sales and marketing tight.
Efficiency metrics require strategic leadership to fix them. Activated Scale’s Fractional Sales Leadership brings in experienced VPs of Sales to align teams for smarter selling.
The real value of KPIs lies in taking action on them. Adjust fast to watch your sales engine accelerate.
Conclusion
Track these 18 metrics with discipline, and your sales will convert rapidly. Reps stop chasing the wrong leads and start focusing on the ones that close. Forecasts become eerily accurate.
Pipeline gaps get filled before they turn into revenue shortfalls. Coaching becomes sharper because you know exactly where deals stall. Competitors start wondering why they keep losing to you. This is what happens when data stops sitting in reports and starts driving every move your sales team makes.
We help you act on the data and accelerate growth without the cost and risk of traditional hiring. Schedule a Call today to hire reps who can measure important KPIs for your team.
FAQs
1. How often should sales performance metrics be reviewed?
At least monthly, with key metrics like pipeline health and quota attainment reviewed weekly for agility.
2. Which metrics are most important for startups?
Focus on pipeline metrics like lead-to-opportunity conversion and sales cycle length to validate early sales processes.
3. How can small teams track these metrics effectively?
Use affordable customer relationship management (CRM) tools with built-in analytics and automate data collection to avoid errors.
4. Should metrics change as the company scales?
Yes, shift emphasis from activity-heavy metrics to efficiency and outcome metrics as your processes mature.
The Ultimate Guide to Hiring a Salesperson!
Get the step-by-step guide to hiring, onboarding, and ensuring success!