_edi.png)

Closing a deal feels like a win, but did you know that an average of 69% of sales reps miss their quota? The culprit? An over-reliance on gut instinct that hides fatal flaws in their process.
So, simply counting wins isn't enough; you need to diagnose your performance with surgical precision. True performance intelligence is about decoding the story behind the numbers and measuring them against real-world benchmarks.
So, what is a good closing percentage in sales? Most importantly, how do you make sure you hit the benchmark without any challenges? In this guide, you'll learn how intentional, data-driven adjustments can give exponential results and accelerate your career growth.
Key Takeaways
- 69% of reps miss quota. Track closing performance weekly to spot leaks fast.
- Closing rate: Biotech averages 15%, software 22%, and finance 19%. Use these to determine a good closing percentage for your sales segment.
- A single “average” won’t fit everyone. However, you can take an average of 29% as a common benchmark.
- Timing shifts results. Weekend connect rates drop to 45%.
- Price talks land best around minutes 13–20 and 40–49, which can lift the closing percentage in sales from target to reality.
Are You Closing Enough Deals?
Many reps focus on chasing more leads, but volume doesn’t always equal success. The real question is how many of those leads actually turn into customers. That’s where the closing percentage comes in.
It shows the share of opportunities that end with a signed deal, helping you see how effective you are at converting interest into revenue.
Sales teams often debate, "What is a good closing percentage in sales?" Any credible sales leader will tell you that fixating on a single, ideal close rate is a mistake. However, most experts agree that the average is 29%.
The true benchmark for success isn't a universal number; it's how you stack up against the competitors within your own industry. Tracking where you land helps you plan better and sharpen your approach.
Your target depends on who you sell to and how you sell. Average rates vary widely across industries, such as:
- Biotech: 15%
- Software: 22%
- Finance: 19%
So you know the average range many reps aim for. However, to actually raise your numbers, you need more than a percentage.
Too many salespeople compare themselves to vague “industry averages” without understanding what’s behind those metrics. That’s where the real learning starts.
Read Also: Effective Sales Strategies, Plans, and Examples for Success
How to Master the Numbers Behind a Good Closing Percentage in Sales?
Most sales development representatives (SDRs) and account executives (AEs) want higher commissions, but few know which number truly reflects their skill.
Once you understand these numbers, you’ll see how to move closer to top-performer territory.
Before we do that, let's go through some important terms that are used interchangeably. However, in reality, that shouldn't be the case.
- Closing percentage measures how many total opportunities you converted into closed-won deals. It reflects overall effectiveness, not just activity.
- Win rate looks specifically at the deals that reached the proposal stage and how many of them you won. It’s a snapshot of how well you finish once the buyer is serious.
- Conversion rate measures earlier actions, such as how many demos, trials, or sign-ups lead to opportunities. It helps you track how well you’re creating chances to sell.
A rep can have a high conversion rate but a weak closing percentage. It signals that opportunities are being lost deeper in the funnel.
How to Calculate Closing Percentage?
Every strong sales analysis starts with this simple formula:
Closing Percentage = (Closed-Won Deals ÷ Total Opportunities) × 100
Pick a consistent time window, like a quarter, and make sure you define “opportunity” clearly. That consistency makes your data reliable.
Example 1:
If you closed 48 deals out of 200 opportunities, your percentage is 24%.
Example 2:
If you won 9 deals from 150 leads generated through a webinar, your percentage is 6%.
Context matters; not all leads are equally ready to buy, and different sources can produce very different outcomes.
Want to see how your current metrics stack up against top performers? Explore job opportunities where you can get a real-world understanding of how to boost your win rate.
Many ask why bother tracking it weekly. Simple: The metric tightens predictions, sharpens coaching, and directs scarce effort. What else? We'll find that out in the next section.
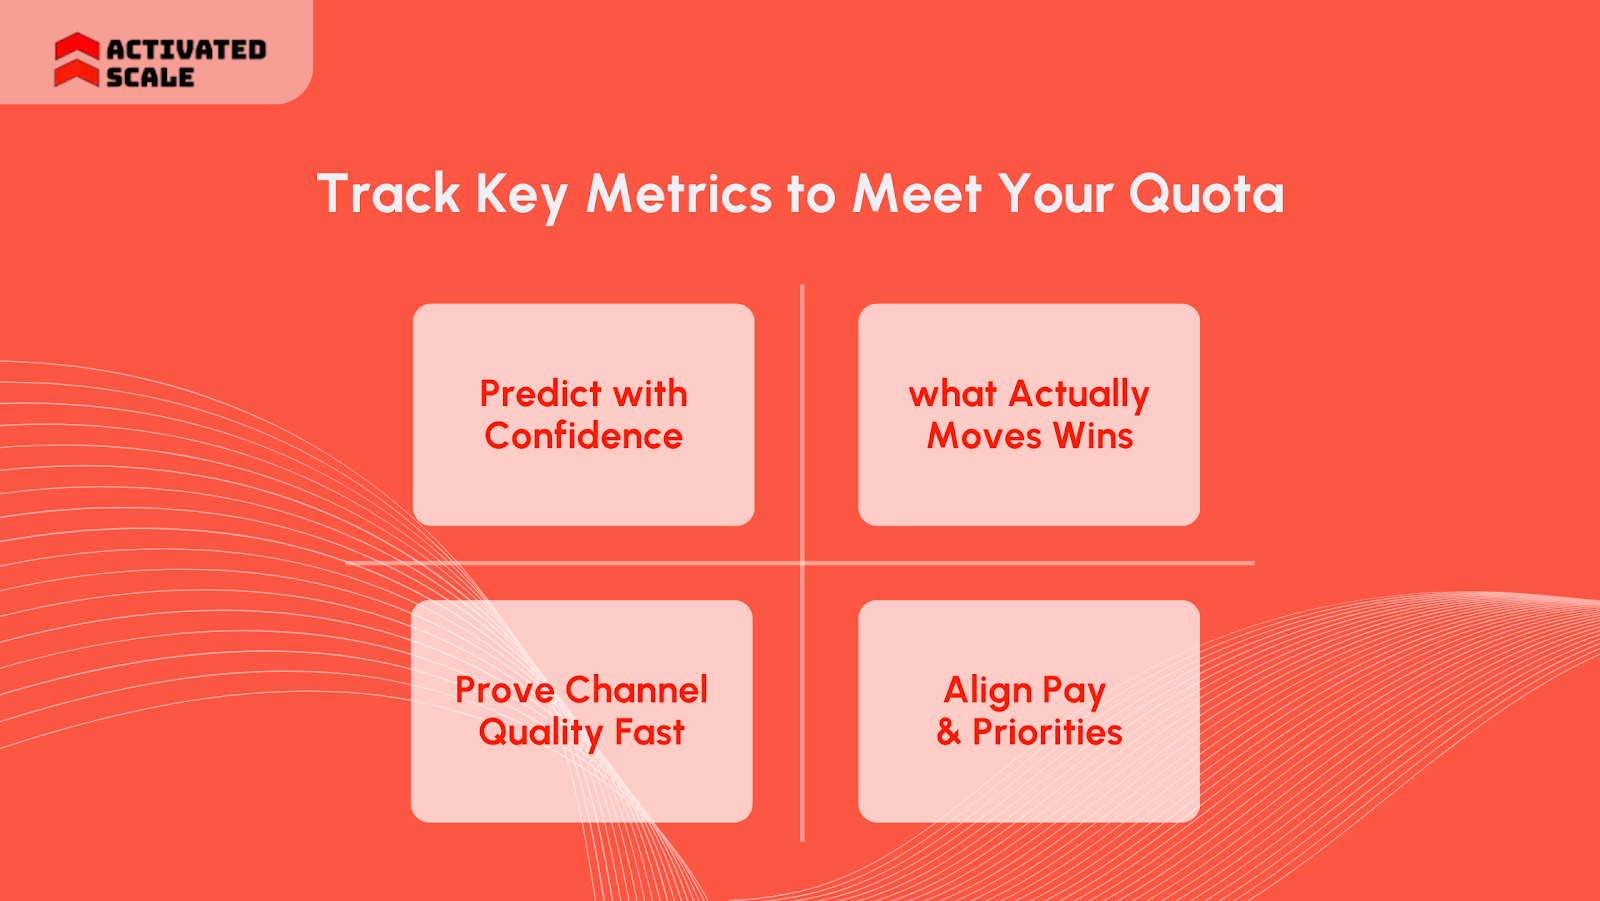
Track What Matters or Miss Quota: Know Why This Metric Rules
In sales, you are what you track. While activity metrics like calls and emails make you feel busy, they're often just vanity numbers that mask the reality.
The single most predictive metric of your success is the one that directly dictates whether you hit or miss your quota.
Ignoring it is professional sabotage. So, here's why you should measure closing percentage:
- Predict with confidence. Leaders need signals that match reality, not hope. Tight tracking of close rate exposes risk early and reduces sandbagging.
- Coach what actually moves wins. Tracking gaps by segment helps customize scripts, talk tracks, and discovery plans for each rep.
- Prove channel quality fast. Close rate by source reveals which campaigns create winnable deals. Retire low-yield sources and double down on proven motions.
- Align pay and priorities. Many plans still anchor on closed-won revenue. Close-rate trends support fair ramps and highlight margin-safe plays at month's end.
Add a simple habits loop next. Log reasons won or lost, review weekly, and push one change.
So, how do you make sure that you keep hitting the "best" number? For that, you need to maintain a weekly guide. So, we have prepared a 6-week plan.
Read Also: 3 Emails that Convert and Why
Your 6-Week Plan to Hit and Improve a Good Closing Percentage
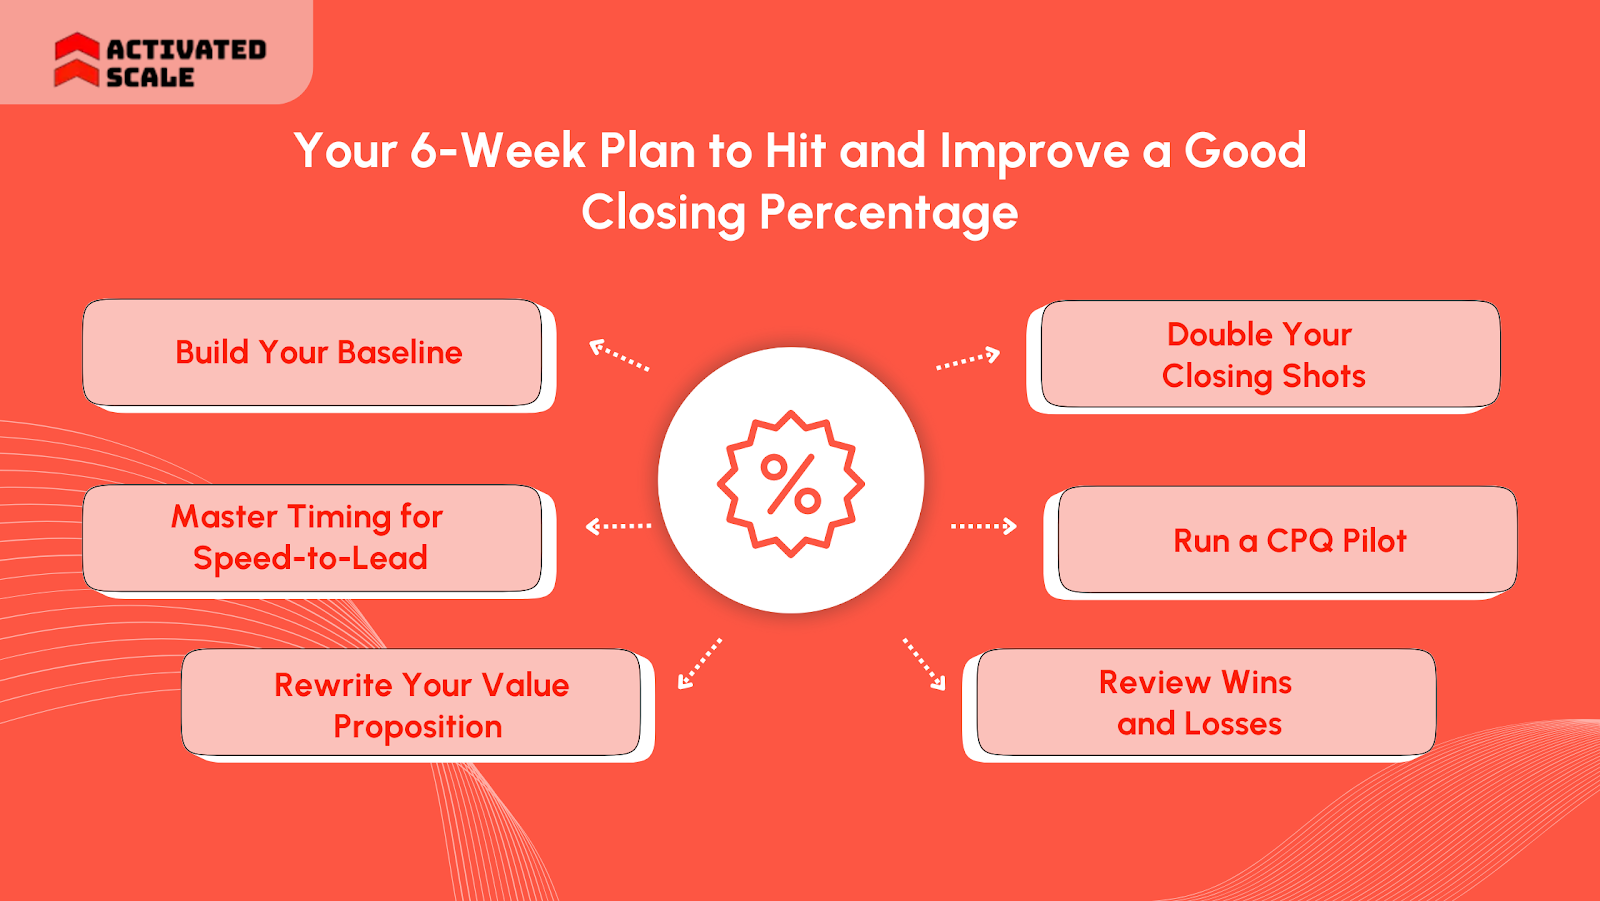
Without a clear system, small mistakes pile up to slow responses, unclear pitches, and deals slip away. This six-week roadmap gives you a repeatable process to raise your numbers, sharpen your skills, and show measurable growth.
Each week builds on the last, turning theory into practice and helping you answer the question every hiring manager asks: What is a good closing percentage in sales, and how close are you to it?
Week 1: Build Your Baseline
Start with clarity. List the exact criteria that qualify a lead as an “opportunity”. You can follow the budget, authority, need, and timeline (BANT) or a similar framework.
Segment your pipeline by source, region, or deal size, then track your current closing percentage in each bucket. This baseline shows where you’re strong and where you’re leaking revenue.
Go through your sales training technique once again to align your definitions with standard benchmarks.
Week 2: Master Timing for Speed-to-Lead
Response speed can make or break deals. Reps who reach out within the first minute are far more likely to convert. Structure your calendar accordingly, as connect rates drop to 45% on weekends.
Add automated routing tools in your customer relationship management (CRM) to cut delays and direct hot leads to the right rep fast. This foundation builds momentum before you touch pricing or pitch tactics.
Week 3: Rewrite Your Value Proposition
Many deals stall because messaging doesn’t match the buyer’s real problem. Rewrite your value proposition to focus on outcomes, not features.
Offer pricing early and simplify the demo process to happen within the first two calls.
Use techniques like Assumptive Close or Alternative Close here. They’re subtle but powerful nudges that keep momentum.
Assumptive Close moves forward as if the buyer already agreed, prompting next steps. Alternative Close offers two purchase choices, both leading to commitment, like the red plan or the yellow plan.
This is also the week to integrate artificial intelligence (AI) tools to automate follow-ups and set service level agreement (SLA) timers. In this way, opportunities don’t cool off.
Week 4: Double Your Closing Shots
Build a framework with open-ended questions that uncover pain, budget, and decision processes early. Then, attempt at least two closes per opportunity, one soft close mid-cycle, and one final.
Layer in therapy-aligned approaches like the Takeaway or Puppy Dog close to test buyer intent without pressure.
Takeaway close removes or limits the offer, exposing intent and urgency without pushiness. Puppy Dog close gives a low-friction trial, letting buyers experience value before committing.
Clean customer relationship management (CRM) inputs during this stage prevent future contract errors and help finance project revenue accurately.
Week 5: Run a CPQ Pilot
A slow, inaccurate quoting process destroys close rates. This week, pilot a CPQ (configure, price, quote) system to speed up approvals and reduce errors. Combine this with structured system upgrades:
- CPQ: Salesforce CPQ is for guided selling, approvals, and discount controls. DealHub CPQ can connect pricing, approvals, and contracts.
- Quotes + e-sign + payments: HubSpot Quotes is for quotes and payments. DocuSign eSignature can be used for fast signatures and renewals.
- Routing & instant booking: LeanData is for lead routing to the right rep. Chili Piper is used for instant scheduling from forms.
- Pipeline analytics & forecasting: Clari for pipeline views, review stage conversion, and weighted pipeline.
- System upgrades to add the same week:
- Auto-calculate annual recurring revenue (ARR), renewal dates, and a commission preview in the opportunity.
- Fields for expansion likelihood and renewal risk to sharpen forecasts.
- Finance-authored billing talk tracks for annual terms.
This combination of tools lifts productivity and lets reps focus on conversations, not admin work.
Week 6: Review Wins and Losses
End the cycle with a full audit. Review every deal: Why it won, why it lost, and where it stalled.
Align finance and sales on approval rules and pipeline valuation. Clear out stale opportunities that skew your data and drain focus.
Review reports weekly at the rep level, monthly by segment, and quarterly with finance. These insights push you closer to that “good” closing percentage in sales.
Fast outreach is still one of the biggest predictors of success. Make first contact within a minute whenever possible, and target your best outreach windows.
Just watch your discount strategy during end-of-month pushes so margin stays healthy while volume grows.
You set the system and started tracking real numbers. Now, clear the blockers that still steal winnable deals.
Read Also: Building High-Quality LinkedIn Sales Navigator Lists
Barriers That Drag Down Close Rates (and Fixes)
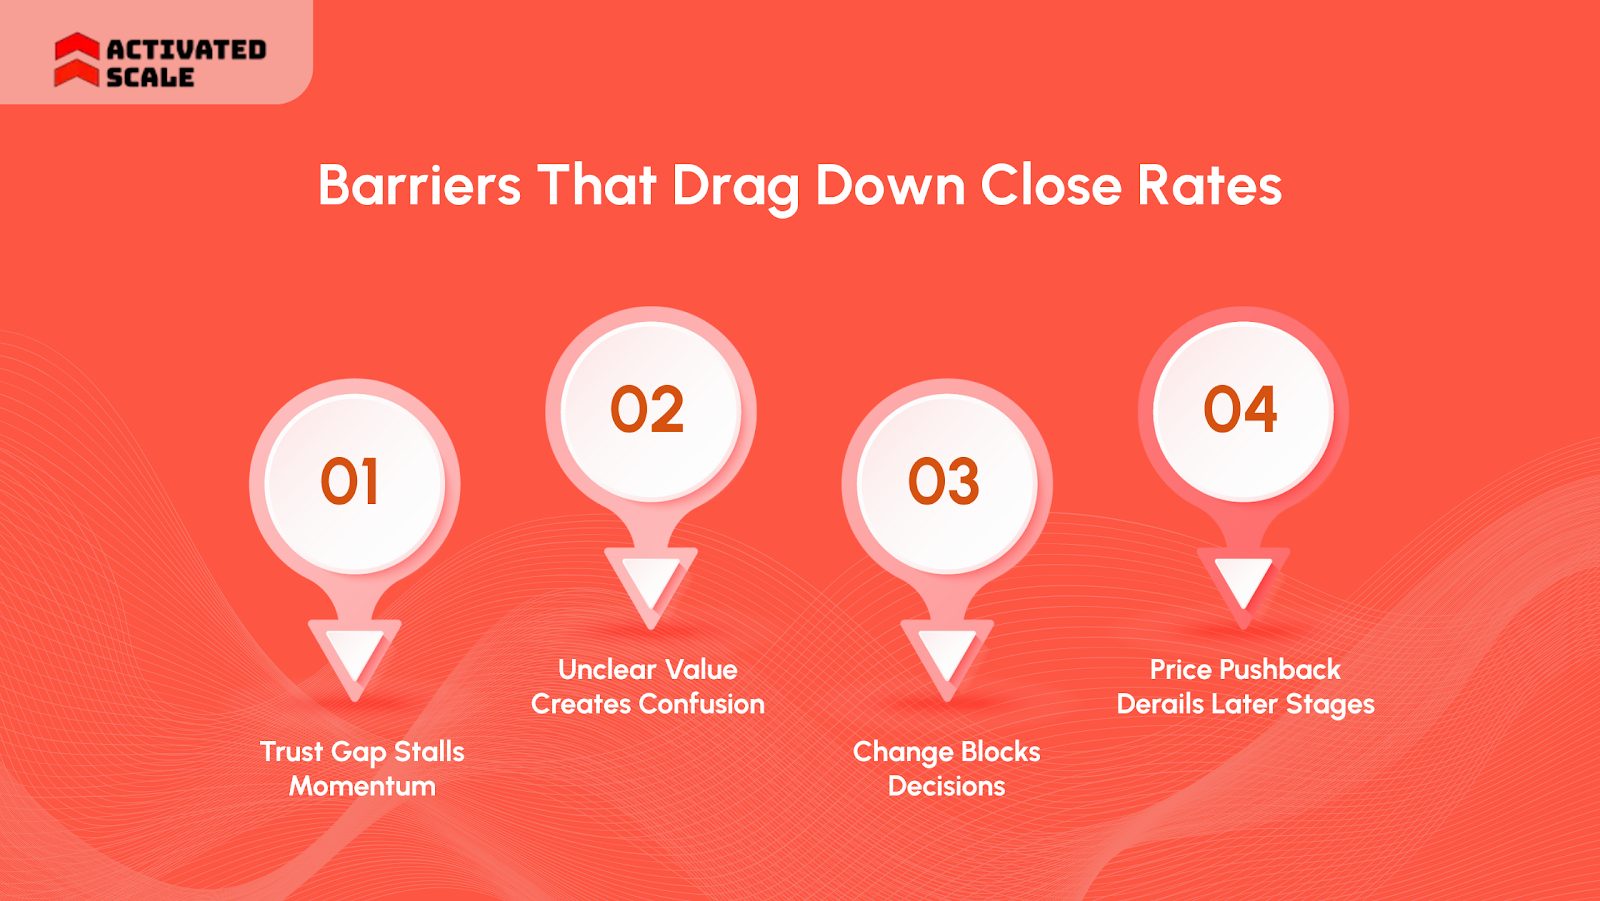
Buyers spend a very minimal time of their journey with sales reps. That means every minute must earn trust and progress. Miss these basics, and strong pipelines still stall.
If you keep asking, "What is a good closing percentage in sales?", remove these four blockers first. Each fix targets a common friction point with simple plays and proof:
1. Trust Gap Stalls Momentum
Buyers doubt sales claims. Trust remains fragile across markets, which lowers openness on calls.
Fixes
- Lead with a proof point and a customer outcome in plain English.
- Share one third-party source or review in follow-ups. Link it, don’t overhype.
- Summarize decisions in writing after each call. Keep the tone person-to-person.
2. Unclear Value Creates Confusion
Prospects want pricing and how-it-works early. Many reps dodge both, which builds friction.
Fixes
- Answer “Why me, why this, why now?” in one short line.
- Show a simple pricing frame once the value is clear. Then confirm fit.
- Send a three-bullet recap: Problem, outcome, next step. Keep it at an eighth-grade level.
3. Resistance to change blocks decisions
Many buyers prefer self-service and avoid sellers. This increases status quo bias and delay.
Fixes
- Name the cost of delay with one number that the buyer gave you.
- Offer a mini pilot or trial to lower risk. Use Puppy Dog or a Summary Close to test intent.
- Log success criteria and the owner in your CRM.
4. Price pushback derails later stages
Poor timing turns price into a fight. Top reps time price windows with care.
Fixes
- Tie price to business outcomes, not line items.
- Hit proven windows after value lands. A strong window stays around 13–20 and 40–49 minutes.
- Close with Alternative Close once the impact is agreed. Offer two clear next steps.
Ready to level up your career? Explore roles at Activated Scale's job portal where your closing skills matter. Show your numbers, and get noticed.
One Final Thought
You want more wins, not more busywork. A simple system, clear definitions, and steady reviews change outcomes fast. Small, consistent habits beat huge overhauls.
Still asking: What is a good closing percentage in sales? Start with your segmented baseline, then run the 6-week plan.
Protect the margin at the month's end. Add trials where risk feels high. Keep pricing clear and early.
Ready to earn more with teams that value results? Explore job opportunities at Activated Scale and bring your numbers to the interview.
FAQs
1. How often should I calculate my closing percentage?
Run it weekly at the rep level. Review it monthly by segment and source. Do a quarterly roll-up with leadership.
2. Should I calculate using leads or opportunities?
Use opportunities only. Set clear entry criteria and keep the time window consistent for both numerator and denominator.
3. How does deal size affect what is a good closing percentage in sales?
Enterprise cycles often show lower rates but larger contracts. Small and medium-sized businesses (SMB) can show higher rates with smaller deals.
4. What if my proposal's win rate looks strong, but deals still slip?
Tighten discovery and confirm success criteria early. Share pricing earlier, agree on next steps, and add a second close attempt.
5. How do I compare performance across lead sources?
Report the close rate by source alongside the discount rate and the time to first response. Shift budget toward sources that convert with fewer concessions.
The Ultimate Guide to Hiring a Salesperson!
Get the step-by-step guide to hiring, onboarding, and ensuring success!