_edi.png)
Quarterly revenue reviews often reveal a frustrating pattern. Sales teams collect huge volumes of CRM data, yet leaders still struggle to understand what is actually happening inside the pipeline. Reports sit in spreadsheets, forecasts change weekly, and deals stall without clear signals explaining why.
A sales operations dashboard solves this problem by turning scattered CRM metrics into a single visual command center. Instead of digging through reports, revenue teams can instantly track pipeline health, win rates, quota progress, and deal velocity in one place.
The impact is real. Companies with strong analytics capabilities are twice as likely to achieve top-quartile financial performance compared with competitors.
In this guide, we’ll explore sales operations dashboard examples, key metrics to track, and how modern revenue teams use dashboards to improve forecasting, pipeline visibility, and sales performance.
Key Takeaways
- A sales operations dashboard gives one a clear view of pipeline health, deal movement, and revenue progress.
- Focus on revenue metrics like pipeline velocity, win rate, conversion rate, sales cycle length, CAC, and LTV.
- Different teams use different views. Executives track forecasts, managers monitor pipeline, and reps track quota and activity.
- Dashboards help teams spot stalled deals, weak qualification, and a slowing pipeline early.
- Metrics like opportunities per rep and response delays show when the team needs more sales capacity.
What Is a Sales Operations Dashboard and Why Sales Teams Depend on It
A sales operations dashboard is a centralized analytics interface that displays the most important sales metrics in a single visual view. It aggregates CRM data, pipeline metrics, activity data, and revenue indicators into charts and tables that leaders can quickly interpret.
Dashboards allow teams to monitor sales performance, track revenue progress, and identify operational issues without running multiple reports.
Why Dashboards Matter in Sales Operations
Sales dashboards translate raw CRM data into operational signals that guide daily decisions. Instead of interpreting spreadsheets, revenue leaders receive structured visibility into pipeline health and team performance.
Key operational benefits include:
- Centralized CRM visibility: All pipeline activity, revenue progress, and deal metrics appear in one view rather than across multiple reports.
- Trend identification: Dashboards make patterns visible. Leaders can quickly detect declining win rates, slowing deal velocity, or falling pipeline coverage.
- Improved forecasting discipline: Revenue projections become more reliable when pipeline and activity metrics update automatically from CRM data.
- Better sales coaching: Managers can identify where reps struggle in the funnel and intervene with targeted training or deal support.
The Three Questions Every Sales Operations Dashboard Must Answer
A useful sales operations dashboard should provide clarity on three operational questions:
When these signals are visible in one place, revenue teams move from reactive reporting to proactive pipeline management.
Sales leaders rarely rely on a single dashboard to answer all operational questions. Different roles require different views of performance.
The next section examines seven sales operations dashboard examples that revenue teams use to track pipeline health, productivity, and growth.
Also Read: 4 Sales Personality Types
7 Sales Operations Dashboard Examples Revenue Teams Use
Different stakeholders in a sales organization track different performance signals. Founders look for revenue predictability, RevOps teams monitor conversion efficiency, and sales managers focus on rep productivity.
.jpg)
The following sales operations dashboard examples show how organizations structure reporting across pipeline management, forecasting, and performance tracking.
1. Pipeline Health Dashboard
A pipeline health dashboard provides a real-time overview of opportunities across the sales funnel. It reveals how deals move through each stage and where opportunities stall.
Pipeline dashboards are widely used by RevOps teams because they reveal structural issues in the sales process, such as qualification gaps or bottlenecks in later funnel stages.
Purpose
Monitor deal progression across pipeline stages and evaluate whether the sales funnel contains enough qualified opportunities to meet revenue targets.
Key metrics include:
- Pipeline value
- Stage conversion rates
- Deal velocity
- Average deal size
Example insight:
If a SaaS company shows strong lead generation but low opportunity-to-close rates, the pipeline dashboard may reveal that deals frequently stall during the proposal stage. Sales leadership can then investigate pricing objections or product positioning issues.
2. Sales Forecast Dashboard
A sales forecast dashboard estimates expected revenue for upcoming quarters using pipeline data and historical performance metrics.
Forecast dashboards combine opportunity data with quota targets and close probability to predict whether the team will meet revenue goals. Accurate forecasts depend heavily on clean CRM data and consistent pipeline updates.
Purpose
Predict revenue outcomes and compare projected revenue with actual sales performance.
Key metrics tracked:
- Quota attainment
- Pipeline coverage ratio
- Forecast accuracy
- Deal slippage
Example insight:
If pipeline coverage drops below the typical 3× quota benchmark, leadership knows the team must generate additional opportunities to maintain forecast reliability.
3. Sales Activity Dashboard
A sales activity dashboard measures daily productivity signals that generate pipeline growth. While revenue dashboards track outcomes, activity dashboards track the effort required to achieve them.
Purpose
Evaluate the level and quality of sales engagement across the team.
Key productivity metrics:
- Calls made
- Emails sent
- Meetings booked
- Opportunities created
Example insight:
If meeting volume declines but pipeline targets remain unchanged, leaders can quickly identify prospecting shortfalls and adjust outreach strategies before pipeline shortages appear.
4. Conversion Performance Dashboard
A conversion dashboard focuses on funnel efficiency. It measures how effectively prospects move from one stage of the sales process to the next.
Conversion analysis helps teams identify where potential buyers lose interest or drop out of the pipeline.
Purpose
Track how efficiently the sales process converts prospects into paying customers.
Important metrics include:
- Lead-to-opportunity conversion rate
- Opportunity-to-close rate
- Win and loss ratio
Example insight:
If opportunity-to-close rates fall below historical averages, the issue may involve pricing objections, weak discovery conversations, or misaligned buyer targeting.
5. Revenue Growth Dashboard
A revenue growth dashboard tracks long-term sales performance and revenue expansion. Unlike operational dashboards, this view focuses on financial outcomes rather than pipeline mechanics.
Revenue dashboards help executives evaluate whether the sales strategy aligns with growth objectives.
Purpose
Monitor revenue expansion and evaluate whether sales performance supports long-term growth targets.
Typical metrics include:
- Monthly recurring revenue
- Sales growth rate
- Average deal size
- New customer acquisition
Example insight:
If revenue growth increases while average deal size declines, leadership may investigate pricing strategy or market positioning.
6. Rep Performance Dashboard
A rep performance dashboard compares the output of individual sales representatives across multiple metrics. Managers rely on this dashboard to identify coaching opportunities and reward top performers.
Performance dashboards also improve accountability because every rep’s contribution becomes visible to leadership.
Purpose
Measure individual sales productivity and track quota achievement.
Metrics commonly included:
- Quota attainment
- Win rate
- Pipeline contribution
- Revenue closed
Example insight:
If a representative generates high pipeline value but consistently misses quota, managers can examine closing skills or deal negotiation practices.
7. Customer Acquisition Dashboard
A customer acquisition dashboard connects marketing performance with sales outcomes. It evaluates how effectively marketing leads convert into paying customers.
Revenue leaders often use this dashboard to identify which channels generate the most profitable pipeline.
Purpose
Track the efficiency and cost of acquiring new customers.
Important acquisition metrics include:
- Cost per lead
- Lead sources
- Lead response time
- Customer acquisition cost
Example insight:
If paid advertising generates many leads but low conversions, sales and marketing teams may adjust targeting or messaging.
Also Read: Sales Development and Operations: A Complete Guide
Which Metrics Should a Sales Operations Dashboard Track?
Many dashboards fail because they prioritize activity counts rather than revenue efficiency. Metrics such as calls made or emails sent indicate effort but rarely explain whether deals actually close. A strong sales operations dashboard focuses on operational indicators that reveal how effectively opportunities convert into revenue.
Sales operations teams usually prioritize metrics that combine pipeline volume, deal value, conversion probability, and cycle speed.
For instance, pipeline velocity measures how quickly revenue moves through the funnel by combining opportunities, average deal size, win rate, and sales cycle length.
Tracking these metrics together gives leaders a clear signal of whether pipeline growth is translating into revenue or simply inflating CRM reports.
Core KPIs Every Sales Operations Dashboard Should Track
The following metrics reveal the operational efficiency of a revenue engine.
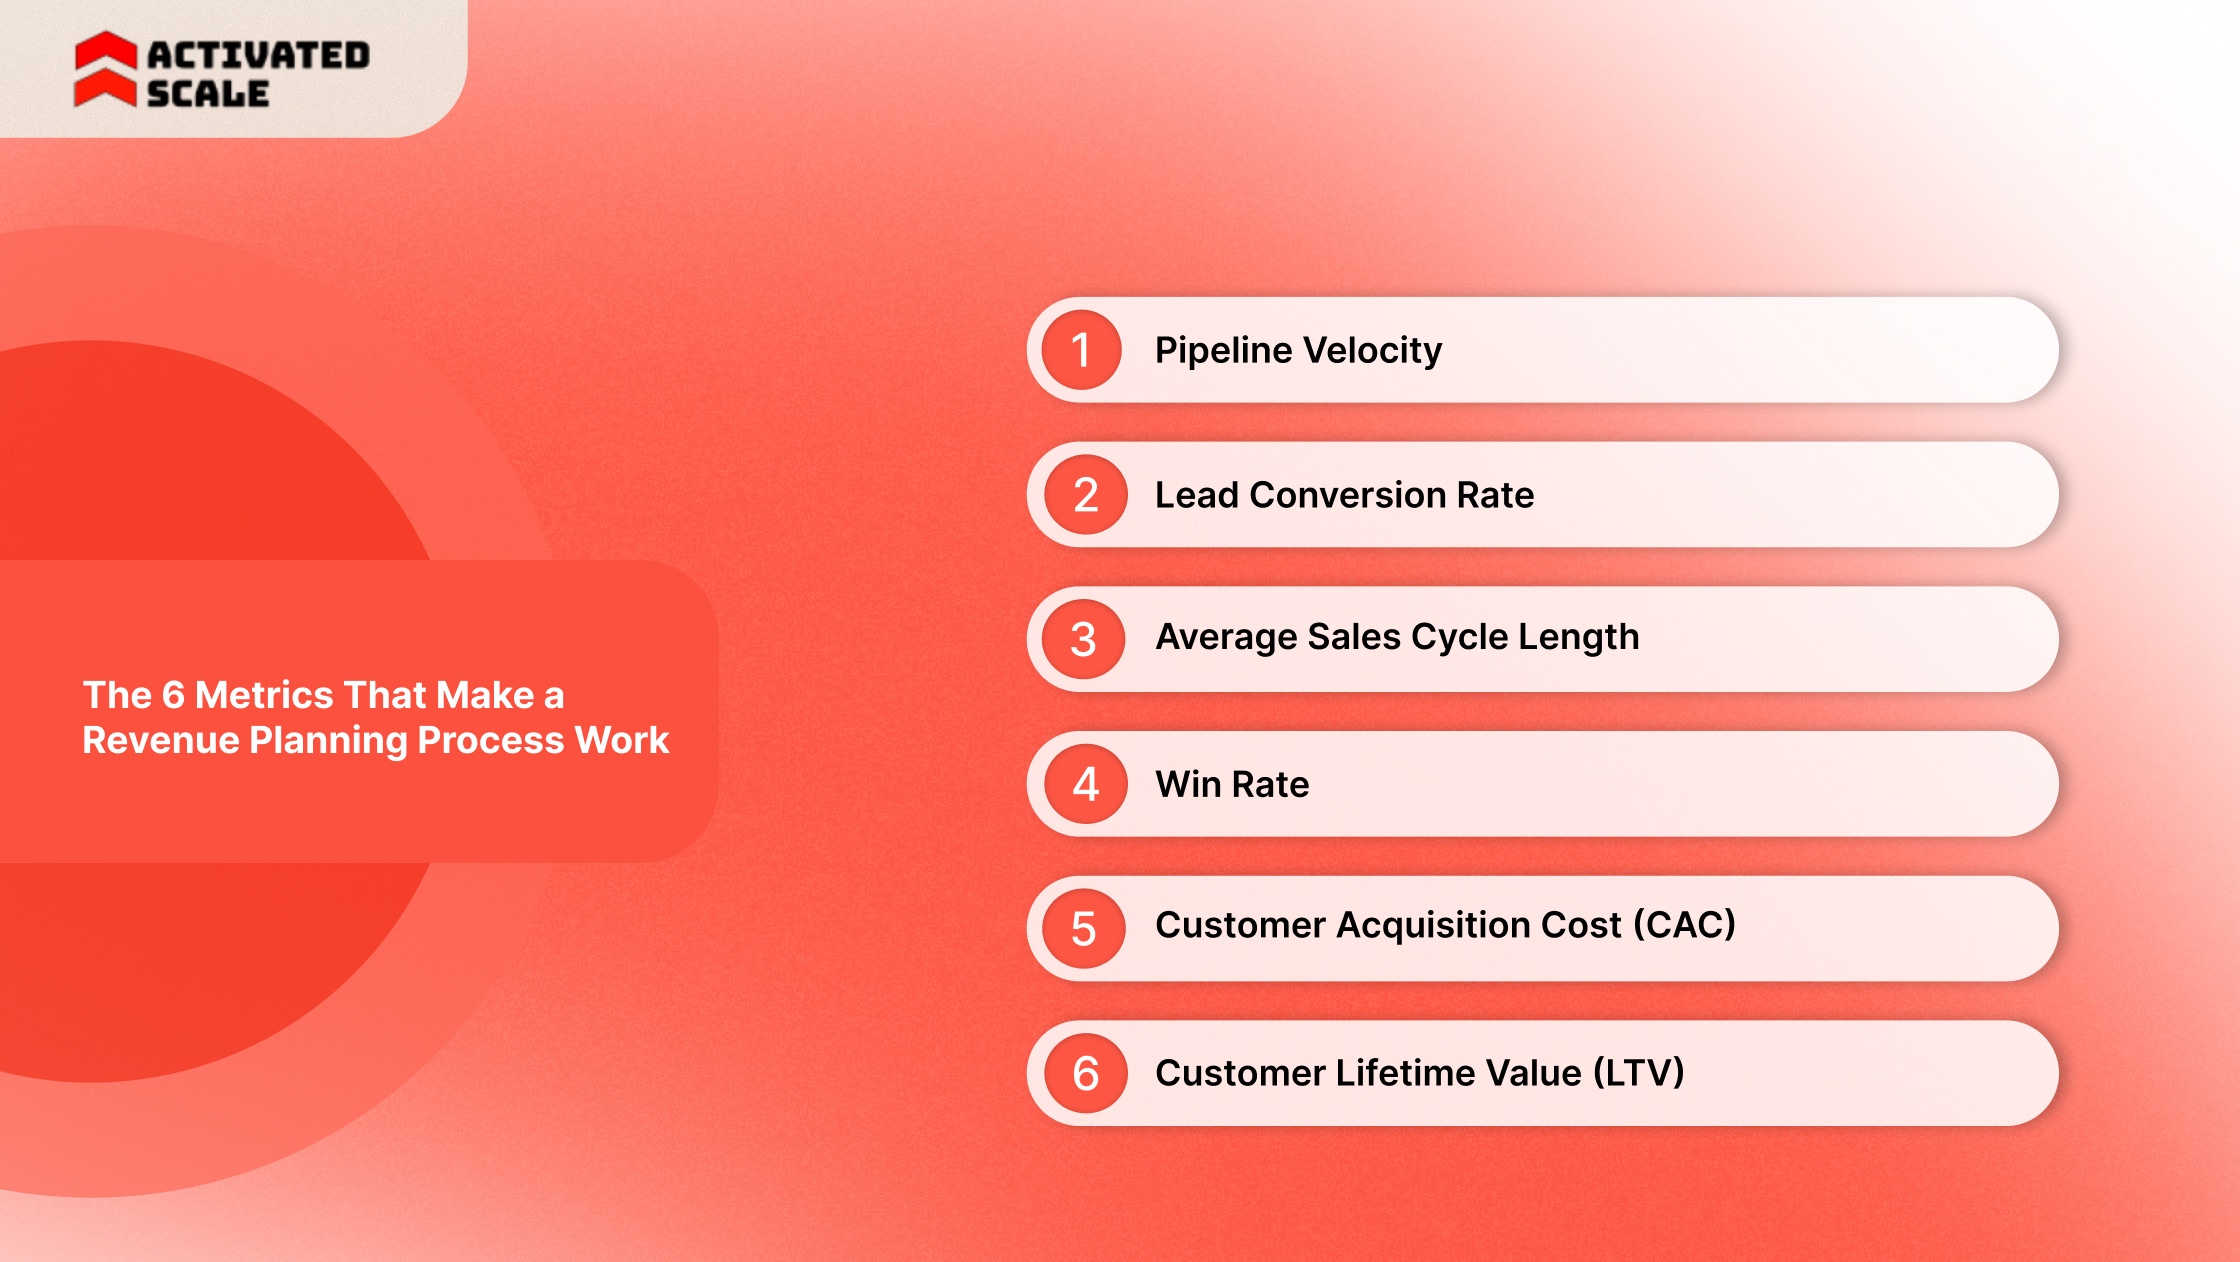
• Pipeline Velocity
Pipeline velocity measures how fast deals convert into revenue by combining opportunity volume, deal value, win rate, and sales cycle length.
Companies that track velocity identify pipeline bottlenecks faster than teams that rely solely on pipeline value.
• Lead Conversion Rate
This metric tracks the percentage of leads that convert into qualified opportunities or customers. A declining conversion rate often signals poor lead targeting or weak discovery conversations.
• Average Sales Cycle Length
Sales cycle length measures the time required for a prospect to move from first contact to closed deal. In B2B environments, complex buying groups and multiple decision makers can significantly extend this timeline.
• Win Rate
Win rate measures the percentage of opportunities that convert into closed deals. It highlights how effectively the sales team converts qualified pipeline into revenue.
• Customer Acquisition Cost (CAC)
CAC measures how much the company spends to acquire each new customer, including sales salaries, marketing spend, and operational costs.
• Customer Lifetime Value (LTV)
LTV estimates the total revenue a customer generates during their relationship with the business. Comparing LTV with CAC reveals whether the sales model remains profitable.
What Each Metric Reveals
A balanced dashboard includes both pipeline efficiency metrics and revenue outcome metrics, giving sales leaders visibility into performance drivers rather than just final revenue totals.
How Startups Use a Sales Operations Dashboard to Fix Pipeline Problems
Startups rely heavily on dashboards because early sales teams operate with limited resources. When revenue targets slip, founders need fast visibility into whether the problem lies in pipeline generation, conversion efficiency, or execution.
Sales operations dashboards expose operational issues before revenue targets collapse. Instead of waiting until the end of the quarter, leaders can detect weak signals inside the pipeline and respond quickly.
Common Pipeline Problems Dashboards Reveal
Sales dashboards help identify patterns such as:
- Pipeline stagnation: Deals accumulate in a single stage and do not progress.
- Rep productivity gaps: Some representatives generate strong pipelines while others fail to create opportunities.
- Forecast instability: Pipeline value appears healthy, yet actual deal closures consistently fall below projections.
- Conversion drops: Opportunities enter the funnel but fail to advance to later stages.
Each of these patterns signals a different operational problem.
Example: Diagnosing a Pipeline Problem
Consider a startup generating strong inbound demand but struggling to close deals.
Initial signals in the dashboard may show:
- High lead volume.
- Large opportunity pipeline.
- Low closed revenue.
Further analysis often reveals deeper issues such as:
- Poor lead qualification criteria.
- Long sales cycles caused by complex buyer approval processes.
- Weak discovery calls or unclear product positioning.
When leaders identify these patterns early, they can refine messaging, improve qualification frameworks, or adjust pricing strategy. However, as startups begin scaling pipeline generation, another operational challenge emerges: sales capacity.
When dashboards show rising opportunity volume but slow follow-ups or delayed deal progression, it often means the team lacks experienced sellers to manage the pipeline effectively.
Platforms such as Activated Scale allow startups to add fractional SDRs, AEs, or sales leaders who can support pipeline execution without committing to full-time hiring.
Hiring and Capacity Planning Signals
A sales operations dashboard often exposes hiring pressure before revenue targets slip. Pipeline growth can create the illusion of strong performance, but operational metrics reveal whether the team has the capacity to manage it effectively.
Sales leaders track workload indicators alongside revenue metrics to understand when the sales organization needs additional bandwidth. One widely used benchmark is pipeline coverage, which compares total pipeline value with revenue targets.
Many SaaS companies maintain a pipeline-to-quota ratio of 3 to 5 to sustain predictable revenue performance.
When opportunity volume exceeds the team's realistic capacity, deal progression slows, and pipeline quality deteriorates.
Signals That Indicate the Team Needs More Sales Capacity
Sales dashboards often surface early indicators that pipeline demand is exceeding the team’s execution capacity.
Common operational signals include:
Pipeline coverage rising while deal movement slows: A pipeline may reach four or five times the quota value, yet deals remain stagnant in later stages. High coverage without movement usually signals limited rep capacity or weak deal management.
Sales representatives consistently exceeding 140 percent of quota: Repeated overperformance suggests strong demand, but concentrated among a small group of high-performing sellers.
Backlog of unworked leads: When inbound demand increases faster than the team can respond, pipeline growth does not translate into revenue.
Slow response to qualified opportunities: Response time strongly affects lead conversion. Research shows that companies that respond to leads within 1 hour are 7 times more likely to qualify those leads than those that respond more slowly.
These signals often appear weeks before missed quotas become visible.
How Sales Dashboards Reveal Hiring Gaps
Operational dashboards link pipeline volume with team workload. Monitoring workload metrics alongside revenue indicators allows leaders to detect capacity constraints early.
Important workload indicators include:
When these indicators rise together, the pipeline may appear healthy while execution quality declines. Deals remain open longer, follow-ups slow down, and conversion rates drop.
Many startups avoid immediate full-time hiring when capacity signals appear. Instead, they add temporary sales bandwidth to validate demand before expanding headcount.
Platforms like Activated Scale connect companies with experienced U.S.-based SDRs and Account Executives who can support pipeline execution during growth periods. This approach allows founders to maintain pipeline momentum while evaluating long-term hiring requirements based on actual sales demand rather than forecasts.
How to Build Your First Sales Operations Dashboard (Step by Step)
Building a useful sales operations dashboard starts with clarity about the decisions the dashboard must support. It should help leaders detect pipeline risks, evaluate performance, and make revenue decisions quickly.
.jpg)
Organizations that implement structured sales dashboards often reduce reporting time and improve decision speed because teams no longer need to extract data from multiple reports.
Step 1: Define the Revenue Questions
The first step is identifying the questions leadership must answer weekly. Dashboards should be designed around these questions rather than around available data.
Examples of revenue questions include:
- Are we on track to hit this quarter’s quota?
- Which pipeline stage loses the most deals?
- Which sales reps generate the strongest pipeline?
- Which opportunities are most likely to close?
Example:
A SaaS company reviewing its dashboard notices that many deals stall during the proposal stage. Leadership investigates pricing objections and updates the proposal process to shorten the sales cycle.
Step 2: Identify the Critical KPIs
A dashboard becomes ineffective when it tracks too many metrics. Dashboard design research shows that five to nine key metrics per dashboard screen prevents information overload and improve decision speed.
Revenue teams usually select metrics that reflect pipeline quality and sales productivity.
Common KPIs include:
- Pipeline value
- Win rate
- Average deal size
- Sales cycle length
- Pipeline velocity
- Conversion rates
- Forecast accuracy
- Revenue closed
Limiting the dashboard to essential indicators makes it easier for managers to identify problems quickly.
Step 3: Integrate CRM and Activity Data
The dashboard should pull data automatically from operational systems. Most modern sales dashboards integrate directly with CRM platforms and sales tools.
Common systems used to build dashboards include:
- HubSpot
- Salesforce
- Business intelligence tools such as Tableau or Microsoft Power BI
CRM integration enables dashboards to automatically update as new opportunities, activities, and deals are added to the system.
Step 4: Build Role-Specific Dashboards
Different stakeholders require different views of sales performance. A single dashboard rarely satisfies every user.
Sales organizations usually design three dashboard layers:
This structure allows each role to focus on the insights most relevant to its responsibilities.
Step 5: Review Dashboards Weekly
Dashboards create value only when they influence decisions. Revenue teams typically review dashboards during weekly sales meetings to evaluate pipeline health and prioritize deals.
During these reviews, managers focus on questions such as:
- Which deals require immediate attention?
- Which reps need coaching?
- Which pipeline stages show declining conversion?
Using dashboards as part of the weekly sales rhythm turns analytics into operational action.
Common Sales Operations Dashboard Mistakes
Many dashboards fail not because of poor technology but because of poor design and usage. Research on dashboard adoption shows that poorly structured dashboards often prompt users to export data to spreadsheets rather than rely on the dashboard itself.
Avoiding the following mistakes helps sales dashboards remain useful for decision-making.
Tracking Too Many Metrics
When dashboards include dozens of metrics, users struggle to identify what matters most. Decision-focused dashboards prioritize a small set of KPIs aligned with revenue goals.
Focusing on Vanity Metrics
Activity metrics, such as calls made or emails sent, do not always reflect pipeline quality. Revenue dashboards should prioritize metrics linked to revenue generation, such as win rate, pipeline velocity, and deal value.
Manual Data Updates
Manual updates create reporting delays and increase the risk of inaccurate forecasts. Automated data synchronization from CRM systems keeps dashboards accurate and up to date.
Lack of Ownership
Dashboards often lose relevance when no team is responsible for maintaining them. Sales operations or revenue operations teams typically manage dashboard structure and data quality.
No Action Tied to Dashboard Insights
Dashboards become ineffective when they serve only as reporting tools. Each metric should trigger a specific action.
For example:
- Declining conversion rates prompt pipeline reviews.
- Slow deal velocity triggers pricing or qualification adjustments.
- Falling pipeline coverage initiates new pipeline generation efforts.
When dashboards connect metrics with decisions, they become operational tools rather than static reports.
Also Read: Essential Sales Tools For Startups And Strategies To Grow
Adding Sales Capacity Without Disrupting Your Dashboard System
A well-structured sales operations dashboard often exposes a common growth challenge. Pipeline volume is rising, but the existing team cannot give every opportunity the attention it deserves. At this stage, many startups gradually expand sales capacity rather than rush into permanent hiring.
Activated Scale helps startups solve this problem by providing vetted U.S.-based sales professionals who can plug directly into an existing sales system.
Key services include:
- Contract-to-hire sales recruiting that allows companies to test experienced sellers before committing to full-time roles.
- Fractional SDRs and Account Executives who generate pipeline and manage deals.
- Fractional sales leadership to design go-to-market strategy, sales processes, and reporting frameworks.
Conclusion
A well-designed sales operations dashboard turns scattered CRM activity into clear operational insight. Instead of reviewing disconnected reports, leaders gain a single view of pipeline health, deal progression, and team productivity. That visibility changes how sales teams operate. Managers can identify stalled deals earlier, improve forecasting discipline, and guide reps with precise coaching rather than general feedback.
Dashboards also reveal patterns that influence bigger decisions. Pipeline velocity may indicate where the sales process needs improvement. Conversion metrics may highlight weak qualifications.
For startups and scaling teams, the next step is execution. The right data reveals where opportunities exist. The right people convert that pipeline into revenue.
Explore how Activated Scale connects startups with experienced U.S.-based sales professionals who can help turn pipeline visibility into consistent revenue growth.
FAQs
Q: How often should a sales operations dashboard be reviewed by leadership?
A: Most revenue teams review dashboards weekly during pipeline or forecast meetings. Weekly reviews allow managers to identify stalled deals, adjust priorities, and coach reps before quarter-end surprises appear. Executive teams usually monitor high-level dashboards monthly to evaluate revenue performance and forecasting accuracy.
Q: What tools are commonly used to build a sales operations dashboard?
A: Most companies build dashboards using CRM platforms such as Salesforce or HubSpot combined with analytics tools like Tableau, Power BI, or Looker. These tools connect pipeline data, activity metrics, and revenue reporting into a single, automatically updating visual interface that updates as deals progress.
Q: How many metrics should a sales operations dashboard include?
A: Effective dashboards usually track eight to ten operational metrics. Including too many metrics creates noise and slows decision-making. Revenue teams typically focus on pipeline velocity, win rate, deal value, sales cycle length, and conversion rates to maintain a clear view of sales performance.
Q: What is the difference between a sales dashboard and a sales operations dashboard?
A: A general sales dashboard often focuses on outcomes such as revenue or quota attainment. A sales operations dashboard focuses on the mechanics behind those outcomes, including pipeline movement, conversion efficiency, and team workload indicators that affect revenue generation.
Q: How can dashboards help founders make hiring decisions in early-stage startups?
A: Founders often use dashboard metrics to determine when the team lacks capacity. Rising pipeline coverage, slower response times, and a growing opportunity load per rep suggest the sales team may need additional SDRs or Account Executives to maintain deal progression and pipeline momentum.
The Ultimate Guide to Hiring a Salesperson!
Get the step-by-step guide to hiring, onboarding, and ensuring success!