_edi.png)
You closed a decent month. Reps feel good. Then the quarter ends, and you missed the number by 30%.
No one saw it coming. Not because the data wasn't there, but because no one was reading it properly. That's what most early-stage sales teams face: not a lack of pipeline, but a lack of visibility into it.
That's exactly the problem pipeline reporting solves. It gives you a clear, structured view of what's in your funnel. This guide covers the key metrics, report types, and a practical framework to help you build it and use it to make smarter decisions as you scale.
In a Nutshell
- Pipeline reporting gives startups real visibility into revenue performance before the quarter ends.
- Inconsistent CRM processes and unclear stage definitions are the main reasons pipeline reporting fails.
- Reports such as stage health, rep performance, and pipeline coverage indicate whether your funnel can realistically hit the target.
- Metrics such as conversion rates, sales cycle length, win rate, and coverage ratio guide forecasting and hiring decisions.
- Strong pipeline reporting requires structure and leadership, often best installed through experienced fractional sales talent.
What Is Pipeline Reporting?
Pipeline reporting, often called sales pipeline reporting, is the ongoing process of tracking, analyzing, and reviewing your sales pipeline to forecast revenue, catch problems early, and make informed business decisions.
Done well, pipeline reporting answers questions like:
- Do you have enough deals in the funnel to hit your quarterly target?
- Where are deals slowing down or dropping off?
- Which reps are closing efficiently, and which ones need coaching?
- Is your forecast realistic, or is it built on stale data?
Unlike forecasting, which focuses on predicting the final number, pipeline reporting focuses on understanding the inputs behind that number. It shows you the structure of your funnel, the quality of your opportunities, and the trends forming weeks before the quarter ends.
Why Many Startups Struggle With Pipeline Visibility?
Most early-stage sales teams don't lack ambition. They lack structure.
According to Gartner, only 45% of sales leaders have high confidence in their own forecast accuracy. That gap starts with poor pipeline visibility. For startups, the problem usually shows up in three specific ways.
- No standard CRM process. Reps log deals differently. Some update stages daily. Others go weeks without touching the CRM. The result is a pipeline that looks full but tells you nothing you can trust.
- No agreed-on stage definitions. Without clear criteria, every rep runs their own system. Managers can't reliably compare, coach, or forecast.
- No consistent review cadence. Without structured reviews, problems surface too late. By the time someone flags a stalling deal, the quarter is almost gone.
Sales pipeline reporting closes this visibility gap by giving founders and sales leaders a real-time picture of deal movement and revenue risk. However, if your CRM also feels inconsistent and your forecasts keep surprising you, then it’s a system issue.
Platforms like Activated Scale can help by placing experienced Fractional VPs of Sales who come in, clean up stage definitions, enforce CRM discipline, and install a reporting rhythm your team can actually rely on. Explore fractional sales talent today instead of trying to solve it internally.
Also read: Guide to Hiring the Right Salesperson for your Business
Types of Pipeline Reports Every Startup Should Run
Most articles on this topic focus on metrics but skip the specific report types that actually surface them. That's the gap. Here are the five reports that give you the clearest picture of pipeline health.
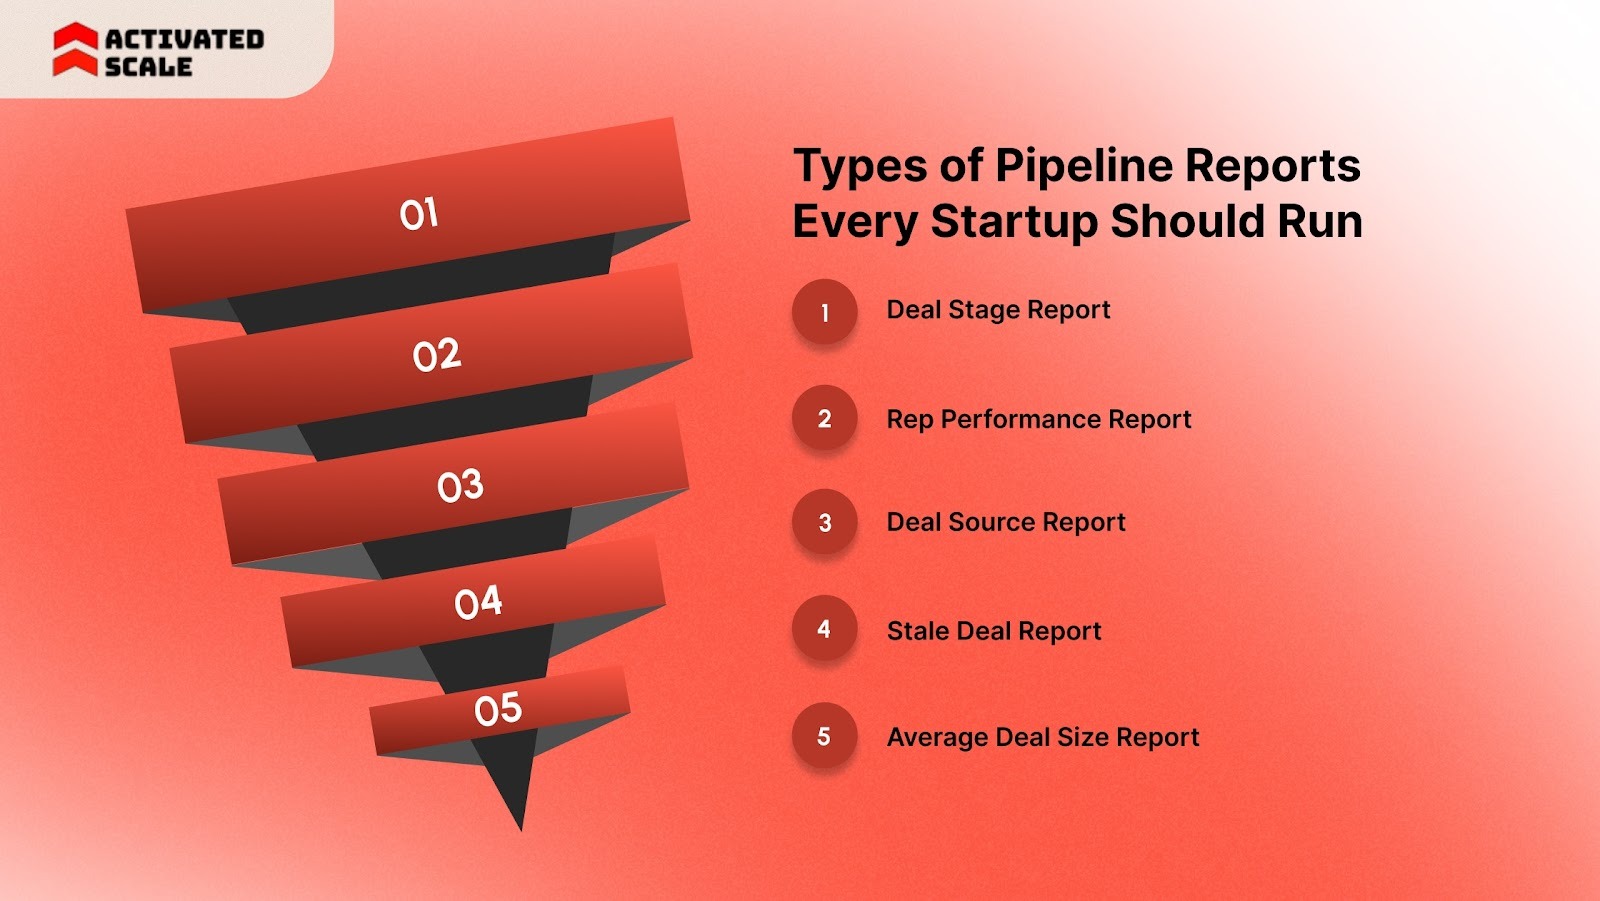
1. Deal Stage Report
Shows the number and value of deals at each pipeline stage. This is your baseline, the first report you review in every pipeline meeting. Use it to identify an imbalance.
2. Rep Performance Report
Breaks down win rate, pipeline value, average deal size, and sales cycle length by individual rep. This is how you identify top performers and find coaching opportunities fast.
Ask: who's converting at the highest rate, and why? Then work to replicate what they're doing across the rest of the team.
3. Deal Source Report
Shows where deals are coming from: outbound, inbound, referrals, or partners. This tells you which channels are generating a pipeline worth pursuing. Most early-stage teams spread effort across every channel. This report tells you where to focus.
4. Stale Deal Report
Flags deals that haven't moved in a set number of days, usually 14 to 30, depending on your sales cycle. Stale deals inflate pipeline value and distort your forecast. Review this weekly. Close out or actively re-engage deals that have been sitting too long.
5. Average Deal Size Report
Tracks the average value of closed-won deals over time. If this number drops, your team may be chasing lower-value accounts. If it grows, you're moving upmarket, which likely stretches your sales cycle.
This metric also feeds into your sales velocity calculation: the clearest single-number view of how efficiently your team generates revenue.
Core Metrics That Make Pipeline Reporting Actionable
A good pipeline report connects data to decisions. Here are the six metrics that matter most for early-stage startups.
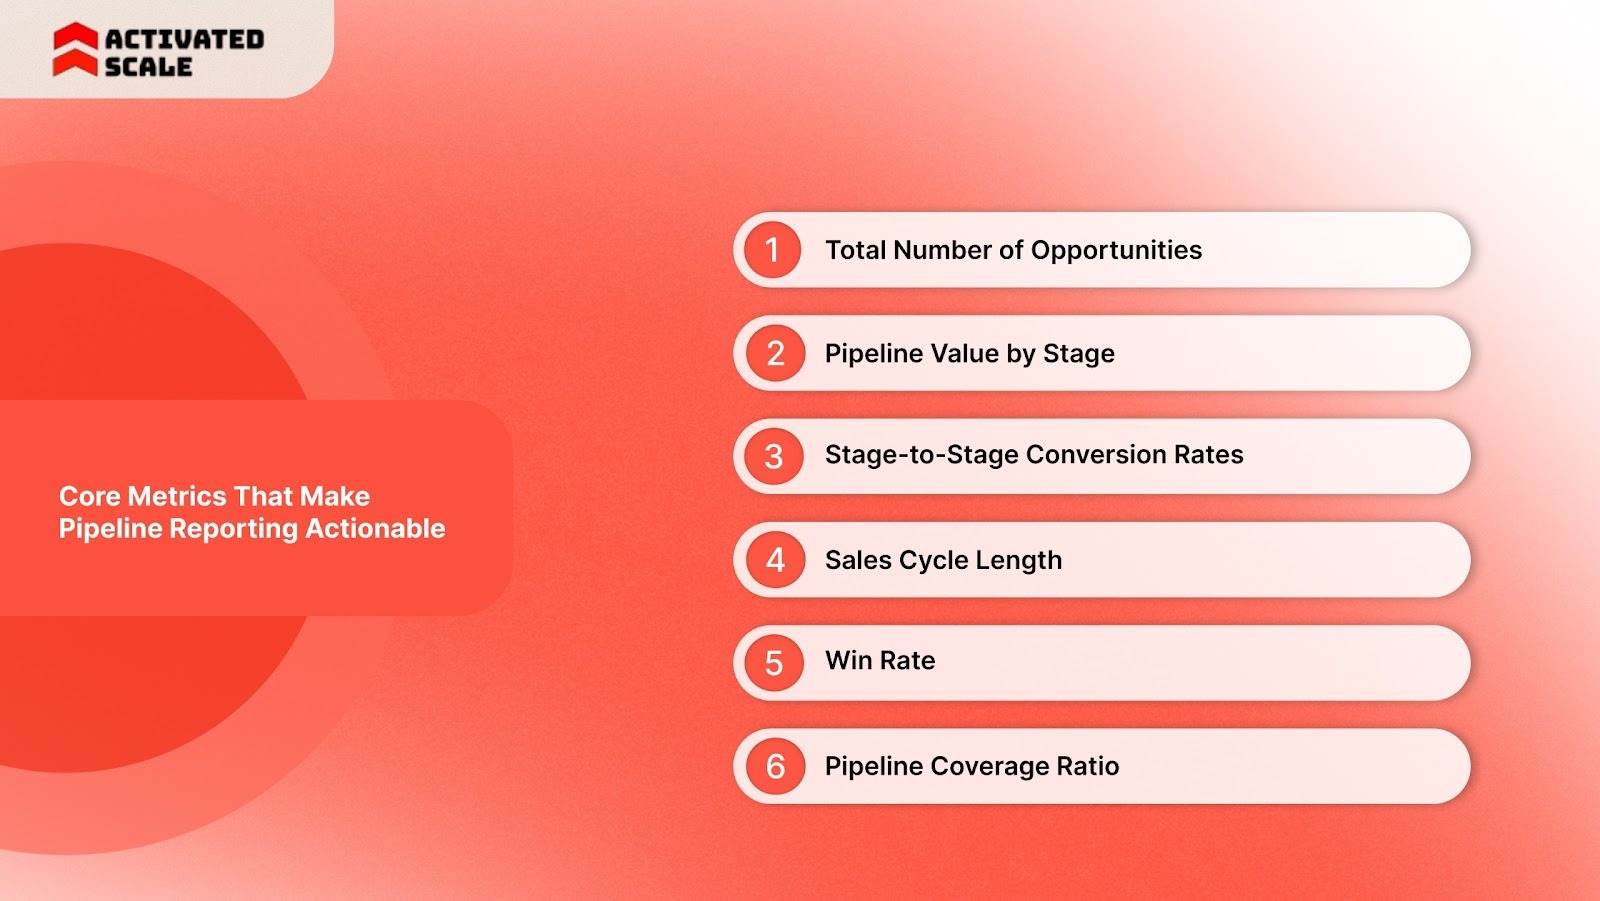
1. Total Number of Opportunities
This is the count of all active deals in your pipeline at any given time. It tells you whether your team is generating enough volume to hit your revenue target, and it's the starting point for every other calculation.
If you need to close 20 deals a quarter and your win rate is 25%, you need at least 80 active opportunities. Track this weekly.
2. Pipeline Value by Stage
This shows the total dollar value of deals at each stage of your sales process. A healthy funnel has deals spread across early, mid, and late stages, not all clustered at the bottom waiting to close.
If your pipeline value is concentrated at one stage, that's a sign of either a prospecting problem or a conversion bottleneck.
3. Stage-to-Stage Conversion Rates
What percentage of deals move from discovery to proposal? Tracking this tells you exactly where your funnel is leaking. If your numbers are significantly lower, examine your qualification criteria before assuming the problem is with your reps.
4. Sales Cycle Length
This is the average number of days from first contact to a closed deal. It matters for two reasons: it helps you forecast when the pipeline will convert to revenue and when deals are stalling.
If your average cycle is 45 days but deals are regularly taking 90, something in your process or your ICP fit needs attention.
5. Win Rate
Win rate is the percentage of opportunities that close as won. Track it by rep, by segment, and by lead source. The overall number is far less useful than the breakdown.
If inbound leads close at 35% and outbound at 12%, that's a conversation about targeting. If one rep closes at 30% and another at 10%, that's a coaching conversation.
6. Pipeline Coverage Ratio
Pipeline coverage is the ratio of total pipeline value to your revenue target. Most successful sales organizations aim for a 3:1 to 5:1 ratio, meaning three to five times the revenue target in the active pipeline.
If you need $500K in revenue this quarter, you should have $1.5M to $2.5M in the pipeline right now. Drop below 2x, and you're in trouble, even if every remaining deal closes.
Also Read: Essential Stages to Build a Strong B2B Sales Pipeline
What a Strong Pipeline Dashboard Looks Like?
Most dashboards show a list of deals. A well-structured pipeline report shows how those deals contribute to your revenue target. The table below displays what each core view should contain and what it should tell you.
The Stage Health View
This is the first thing you check. It shows the pipeline value and the number of deals at each stage, side by side.
What a good stage health view looks like:
What you're reading: Deals are spread across stages, not all piling up at the bottom. If 30 of your 42 deals were sitting in Negotiation, that signals a top-of-funnel drought. If Proposal Sent had the highest average days, that's where you dig in next.
The Rep Performance View
This breaks down every rep's pipeline by win rate, average deal size, and cycle length. The goal isn't to rank people. It's to understand what behavior drives results.
What a rep performance view looks like:
What you're reading: Rep B has the largest pipeline but a lower win rate and a longer cycle. It likely means they're advancing deals that aren't fully qualified, or they need support closing. Rep C has the highest win rate with the shortest cycle. That's the behavior you study and coach toward.
The Pipeline Coverage View
This is the fastest health check for any sales leader. It compares your active pipeline value against your quarterly revenue target.
What a coverage view looks like:
What you're reading: A 3.7x ratio is healthy given normal deal slippage. A 1.6x ratio means you almost certainly won't hit the number unless nearly every deal closes. A 4.8x ratio gives you a buffer but should prompt a check on deal quality. Inflated pipelines can mask poor qualification.
A good pipeline report connects all three views. Stage health tells you where deals are. Rep performance tells you who's driving them. Coverage tells you whether the whole picture adds up to a number you can actually hit.
A Practical Pipeline Reporting Framework for Scaling Startups
Building a sales pipeline reporting system doesn't require a big team or expensive tooling. It requires structure. Here's how to set it up in five steps.
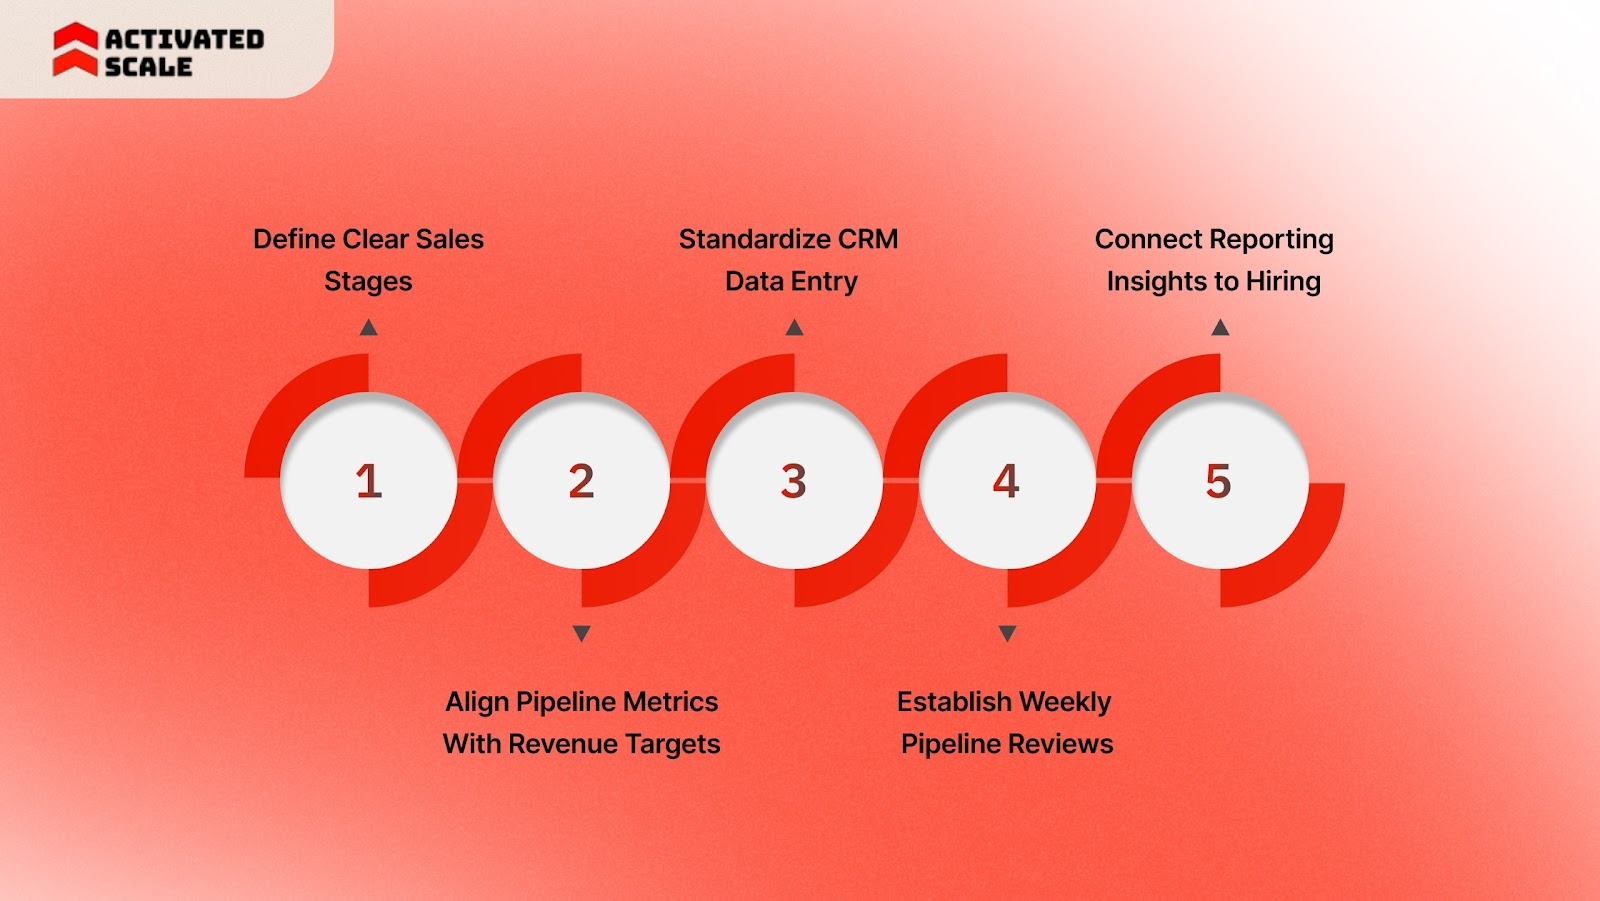
1. Define Clear Sales Stages
Before you can report on the pipeline, the stages need to mean the same thing to every rep on your team.
Each stage should have:
- A clear definition of what qualifies a deal to be there.
- Specific exit criteria: what needs to happen before a deal moves forward.
- An expected time range for how long deals typically stay in that stage.
Five to seven stages are usually enough. More than that creates noise and inconsistent tracking.
2. Align Pipeline Metrics With Revenue Targets
Every metric in your pipeline report should connect back to a question leadership needs answered. Start with your quarterly revenue target and work backwards:
- What win rate do you need to hit that number?
- What average deal size are you assuming?
- What pipeline coverage ratio does that require?
- How much new pipeline do you need to generate each week?
This keeps reporting tied to outcomes.
3. Standardize CRM Data Entry
The most common reason pipeline reports are unreliable is dirty data. Set clear expectations across your team:
- Required fields before a deal can advance to the next stage.
- Standard naming conventions for deal names and company records.
- A rule that requires a logged reason for changes to the close date.
- Weekly hygiene reviews to flag stale deals or incomplete records.
4. Establish Weekly Pipeline Reviews
A weekly pipeline review is different from a forecast call. The goal is to manage deal health in real time, not to predict the quarter.
A good weekly review covers:
- New deals added and their source.
- Deals that advanced versus deals that went stale.
- Coverage ratio against quota.
- Top deals at risk and the next action to move them forward.
- Coaching priorities based on conversion trends.
Keep it to 30 to 45 minutes. If the data is clean and everyone comes prepared, that's enough time.
5. Connect Reporting Insights to Hiring and Budget Decisions
Pipeline reporting is also a business planning tool. When you see consistent capacity problems (reps carrying too many deals, cycles stretching, conversions dropping), that's a signal to hire. When one channel consistently outperforms, that's where to invest.
Use quarterly pipeline trends to justify headcount decisions, sales tool investments, and go-to-market adjustments. The data makes those conversations faster.
Also Read: Sales Pipeline Templates for Improved Tracking
How to Implement Sales Pipeline Reporting Without Overcomplicating It?
The biggest mistake startups make is trying to build everything at once.
Start with three things:
- A defined stage structure, even if it's simple.
- A weekly review habit, even if the data isn't perfect yet.
- Two or three core metrics: pipeline value by stage, win rate, and coverage ratio.
Add complexity as your data matures. Most early-stage teams don't need a 20-metric dashboard. They need a handful of reliable numbers that they look at every single week.
The goal early on is to build the habit of using data before you worry about having the perfect system.
If you're still figuring out which metrics to prioritize or how to structure your sales motion, Activated Scale connects startups with fractional sales leaders who can walk in and build the framework from day one.
Pipeline Reporting Assessment: Is Your Pipeline Healthy?
Use this checklist to evaluate where your team stands today.
If you checked fewer than eight, your pipeline reporting needs work before your team can scale predictably.
How Activated Scale Helps Startups Build Structured, Scalable Sales Systems?
Building a pipeline reporting system requires sales leadership that knows how to design the process, train the team, and hold reps accountable for consistently using it.
That's exactly what Activated Scale is built for.
Activated Scale is a sales talent marketplace that connects U.S.-based startups with vetted, experienced sales professionals on flexible, contract-to-hire terms.
With Activated Scale, you get:
Fractional VPs of Sales Who Build the Infrastructure
Many early-stage startups don't need a full-time VP of Sales yet. They need someone experienced who can install the right systems, including pipeline reporting, without a permanent hire.
Activated Scale's fractional sales leaders have built GTM motions across industries. They come in, assess the current state, define stage structures, set CRM standards, and establish the review cadence your team needs to run with predictability.
SDRs and AEs Who Feed Clean Pipeline From Day One
Bad pipeline data starts at the top of the funnel. If reps aren't qualifying correctly or logging accurately, everything downstream is unreliable.
Activated Scale connects you with vetted U.S. SDRs and AEs who understand structured sales processes. They qualify to defined criteria and operate within the pipeline frameworks your leadership sets, so the data your reports are built on actually reflects reality.
Flexible Hiring That Matches Your Stage
Committing to a full sales team before your reporting structure is proven is a quick way to scale noise rather than revenue. Activated Scale's contract-to-hire model lets you bring in experienced talent to validate your process and test your pipeline assumptions before making permanent hires.
That flexibility means your reporting infrastructure gets stress-tested in real conditions.
Conclusion
At some point, every growing startup reaches the same realization: effort alone doesn’t create predictability. Systems do.
Pipeline reporting becomes the difference between reacting to missed numbers and managing revenue with intent. As targets increase and headcount expands, weak structure compounds. Stronger structure compounds faster.
If your next stage of growth depends on cleaner execution and clearer visibility, strengthening your sales infrastructure may be the smartest move you make this quarter.
Activated Scale gives startups access to vetted, U.S.-based fractional sales leaders, SDRs, and AEs who can step in and build that structure without long-term hiring risk.
Book a demo to explore how Activated Scale can help you scale revenue with the right sales talent in place.
FAQs
1. What does a pipeline report look like?
A pipeline report shows deals grouped by stage, including deal count, total value, average time in stage, conversion rates, and coverage against revenue targets to assess performance.
2. How often should pipeline reporting be reviewed?
Early-stage startups should review pipeline reporting weekly to catch stalled deals, monitor coverage ratios, track conversion trends, and adjust hiring or prospecting efforts before problems compound.
3. What is a healthy pipeline coverage ratio?
Most SaaS teams aim for a 3:1 to 5:1 pipeline coverage ratio, meaning three to five times the revenue target in active opportunities to absorb slippage.
4. What is the difference between pipeline reporting and forecasting?
Pipeline reporting analyzes deal movement, stage health, and conversion trends, and forecasts expected revenue based on weighted opportunities and projected close dates.
5. How do you know if your pipeline reporting is unreliable?
Frequent forecast misses, inconsistent CRM updates, unclear stage movement, and inflated pipeline values are common signs that your pipeline reporting lacks structure and discipline.
The Ultimate Guide to Hiring a Salesperson!
Get the step-by-step guide to hiring, onboarding, and ensuring success!