_edi.png)
Today, marketing teams run campaigns across search, social media, email, and paid advertising. Each channel generates large volumes of data, yet many organizations still struggle to translate that information into clear growth decisions.
Budgets are under scrutiny, and marketing leaders must prove how their efforts influence pipeline and revenue. The challenge is that data alone does not automatically lead to insight. In fact, Gartner research shows that marketing analytics currently influences only about 53% of marketing decisions, meaning nearly half of strategic choices are still made without strong data support.
This gap shows why a structured marketing analytics strategy matters. Companies need more than scattered dashboards. They need a system that connects marketing data to real revenue outcomes. A clear strategy reveals which channels drive qualified demand, where budgets should shift, and how marketing contributes to growth.
This blog explores the core components of a marketing analytics strategy and the key benefits organizations gain when marketing data is turned into actionable insight.
Key Takeaways
- A marketing analytics strategy connects campaign data with pipeline and revenue outcomes.
- Core components include data collection, tool integration, attribution models, and reporting dashboards.
- Teams track metrics such as customer acquisition cost, conversion rates, and marketing-sourced pipeline.
- Common tools include Google Analytics, HubSpot or Marketo, Salesforce CRM, and Tableau or Looker dashboards.
- Key trends include AI-driven insights, predictive analytics, real-time optimization, and unified marketing and sales analytics.
What Is a Marketing Analytics Strategy?
A marketing analytics strategy focuses on measuring marketing performance across channels and translating those signals into business decisions that affect growth.
It usually involves three operational responsibilities:
- Measuring campaign performance across search, paid media, email marketing, and social channels
- Connecting engagement metrics with pipeline creation and revenue generation
- Identifying which acquisition channels produce high-quality customers
Example:
A SaaS company running search ads, LinkedIn campaigns, and webinars may discover, through analytics, that webinar leads convert into opportunities at 3x the rate of paid ad leads, prompting a shift in marketing spend.
Marketing Analytics vs Traditional Campaign Reporting
Traditional marketing reports measure activity within individual campaigns. Marketing analytics evaluates performance across the entire customer journey and connects those insights with revenue.
This shift matters because marketing performance is increasingly tied to business outcomes. According to HubSpot research, over 41 percent of marketers now measure the success of their marketing efforts through sales outcomes rather than engagement metrics alone.
Organizations that align marketing analytics with revenue metrics gain clearer visibility into how marketing contributes to growth.
Types of Marketing Analytics
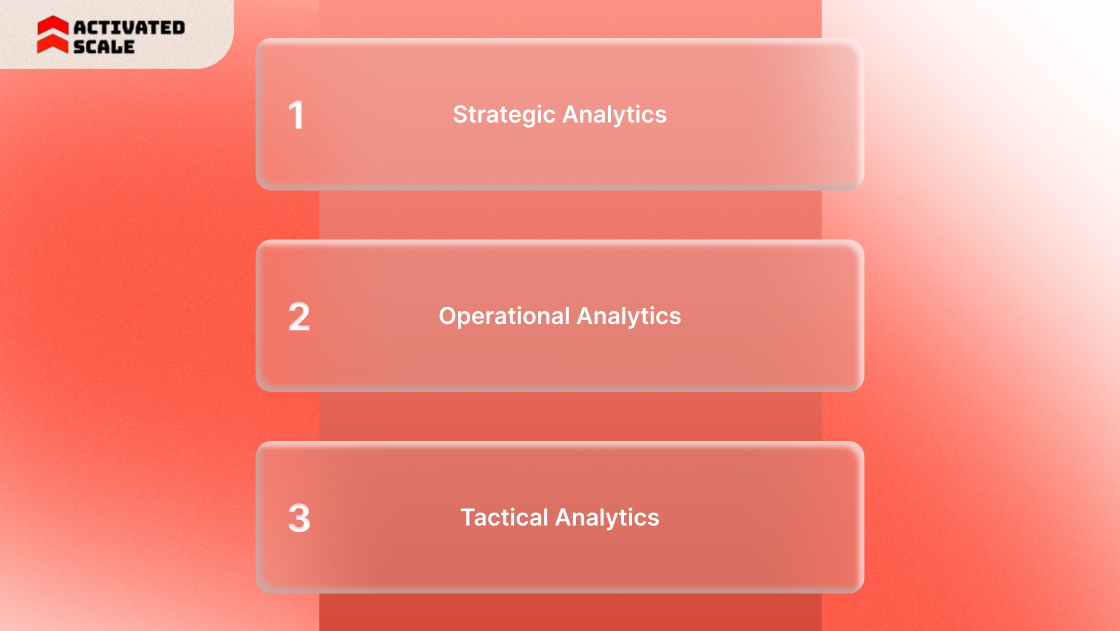
Different types of analytics answer different business questions. Effective marketing strategies combine multiple layers of analysis.
1. Strategic Analytics
Strategic analytics evaluates long-term market patterns and customer behavior. The focus is on identifying growth opportunities across industries, buyer segments, and product categories.
Example:
A B2B company may analyze which industries generate the highest lifetime customer value and prioritize campaigns targeting those segments.
2. Operational Analytics
Operational analytics tracks day-to-day campaign performance and marketing channel efficiency.
Teams typically monitor metrics such as:
- Cost per lead
- Conversion rates across channels
- Customer acquisition cost
This layer helps marketing leaders adjust budgets and campaign targeting in real time.
3. Tactical Analytics
Tactical analytics focuses on short-cycle experimentation that improves campaign performance.
Common approaches include:
- Landing page testing
- Email subject line experiments
- Ad creative testing
Example:
A marketing team testing two landing pages might increase conversion rates by identifying which page design generates more demo requests.
Also Read: How to Hire the Best Marketing Agency
Why Does Marketing Analytics Strategy Matter Now?
Marketing teams operate in an environment where buyers interact with brands across multiple channels before making a decision. Campaign data flows from advertising platforms, marketing automation systems, websites, and CRM tools.
Without a structured analytics strategy, organizations struggle to connect these signals to revenue outcomes.
Modern buyer behavior illustrates why analytics has become central to marketing strategy. B2B buyers complete around 70 percent of their purchasing research before contacting vendors, which means marketing content and campaigns shape decisions long before sales conversations begin.
Analytics helps organizations understand which marketing activities influence this early research stage and which channels drive qualified demand.
1. Explosion of Marketing Data
Marketing teams now generate massive amounts of behavioral data through digital channels and marketing technology platforms. Each campaign, interaction, and engagement produces signals that reveal how prospects move through the buyer journey.
Several factors contribute to this rapid growth in marketing data:
- Multichannel campaigns across search, social media, paid advertising, and email marketing
- Marketing technology stacks integrating CRM platforms, automation tools, and analytics software
- Product usage data combined with marketing engagement data
The growth of analytics platforms reflects this shift. The marketing analytics market is expected to grow from $8.02 billion in 2026 to $14.55 billion by 2031, as companies increasingly rely on data-driven marketing decisions.
Organizations that cannot interpret this data effectively struggle to determine which campaigns generate meaningful pipeline impact.
2. Revenue Teams Need Clearer Attribution
Marketing teams frequently report engagement metrics such as impressions or downloads. Revenue leaders want to understand which marketing activities contribute directly to pipeline and sales outcomes.
Attribution frameworks address this challenge by connecting marketing activity with revenue metrics.
A structured analytics model helps organizations measure:
- Marketing-sourced pipeline
- Customer acquisition cost
- Channel-level return on investment
Example:
A prospect may discover a company through a search query, attend a webinar, and later convert through a sales conversation. Attribution analysis identifies which interaction played the strongest role in the final purchase decision.
When analytics reveals which campaigns generate qualified demand, startups often need experienced sellers to convert those opportunities into revenue. Platforms like Activated Scale connect startups with vetted US-based SDRs and Account Executives who help convert inbound demand into pipeline without long hiring cycles.
The 5 Core Components of a Marketing Analytics Strategy

A strong marketing analytics strategy depends on several operational components that transform raw marketing data into actionable business insights.
1. Reliable Data Collection
Every analytics strategy begins with consistent data collection across marketing and sales platforms. Marketing teams must capture performance signals from each interaction prospects have with the brand.
Typical data sources include:
- Website analytics platforms measure visitor activity
- Advertising platforms such as Google Ads and LinkedIn Ads
- CRM systems track leads, opportunities, and revenue
- Marketing automation tools record campaign engagement
Example:
A SaaS company hosting webinars can connect registration and attendance data with CRM opportunity records. This allows the marketing team to see how many webinar participants later convert into sales opportunities.
2. Data Integration Across Platforms
Marketing data often exists across separate systems. Integration ensures these signals are connected, enabling teams to analyze the entire buyer journey.
Integrated data environments commonly include:
- Marketing automation platforms
- Customer relationship management systems
- Product analytics tools
- Centralized data warehouses
When these systems operate independently, marketing teams struggle to determine how channel engagement influences revenue outcomes.
Integrated datasets enable organizations to evaluate the full impact of marketing activities.
3. Attribution and Revenue Measurement
Attribution models identify which marketing touchpoints contribute to customer acquisition.
Several attribution approaches are commonly used.
Revenue metrics typically measured include:
- Customer acquisition cost
- Marketing-sourced pipeline
- Campaign return on investment
These metrics help marketing leaders understand which channels produce profitable customer acquisition.
4. Insight Generation and Visualization
Large datasets become useful only when they are interpreted clearly. Visualization tools transform marketing data into insights that executives can easily evaluate.
Typical analytics outputs include:
- Campaign performance dashboards
- Customer cohort analysis
- Segmentation by industry, company size, or acquisition channel
Visualization allows marketing leaders to identify performance trends and detect issues early.
Organizations that rely on analytics dashboards can evaluate marketing performance faster than teams reviewing manual reports.
5. Decision Making and Optimization
The final stage of a marketing analytics strategy converts insights into operational improvements. Marketing teams use analytics to refine campaigns, allocate budgets more effectively, and improve targeting strategies.
Common optimization actions include:
- Increasing spend on high-performing channels
- Testing new messaging and creative strategies
- Adjusting audience targeting based on performance data
Marketing analytics strategies follow a continuous improvement cycle.
This cycle helps organizations continuously improve marketing efficiency and pipeline generation.
Also Read: Build a Marketing Operations Strategy in Easy Steps: A 2026 Guide
What Metrics Should a Marketing Analytics Strategy Track?
Marketing analytics focuses on metrics that reveal how marketing activities influence pipeline creation and customer acquisition.
Key metrics usually fall into three categories.
Acquisition Metrics
Acquisition metrics evaluate how effectively marketing programs generate new leads.
Important metrics include:
- Cost per lead
- Lead conversion rate
- Customer acquisition cost
These metrics help determine whether marketing spend produces qualified opportunities.
Engagement Metrics
Engagement metrics measure how prospects interact with marketing content.
Examples include:
- Website engagement and session depth
- Content downloads or webinar attendance
- Email open and click-through rates
Strong engagement signals often indicate higher purchase intent.
Revenue Metrics
Revenue metrics connect marketing performance with financial outcomes.
Typical revenue metrics include:
- Marketing-sourced pipeline
- Opportunity conversion rate
- Customer lifetime value
These metrics help leadership teams evaluate marketing performance from a revenue perspective.
Tools That Support a Marketing Analytics Strategy
A marketing analytics strategy depends on the right tools for collecting, integrating, and interpreting marketing data. These tools help teams track customer behavior, measure campaign performance, and connect marketing activity with revenue outcomes.
Most B2B companies rely on a combination of analytics, CRM, and reporting platforms.
These tools allow marketing teams to monitor performance across channels and evaluate which campaigns generate qualified leads. When analytics data is integrated with CRM and pipeline data, companies gain clearer visibility into how marketing contributes to revenue growth.
The Real Benefits of a Marketing Analytics Strategy
Organizations that adopt structured analytics strategies gain clearer visibility into marketing performance and customer acquisition patterns.
The most significant benefits include:
- Better marketing budget allocation across channels
- Improved lead quality through data-driven targeting
- Faster identification of high-performing campaigns
- Improved coordination between marketing and sales teams
Companies that rely on analytics-driven decision-making often outperform competitors in revenue growth. Research shows insights-driven organizations are 8.5 times more likely to achieve annual revenue growth of at least 20 percent.
Analytics helps organizations identify which marketing activities produce measurable business impact.
How Companies Build a Marketing Analytics Strategy (Step by Step)
Building a marketing analytics strategy does not start with dashboards or tools. It begins with clarity about what the business wants to measure and why. Most successful companies treat analytics as a process that connects marketing performance with pipeline and revenue outcomes.
.jpg)
The steps below show how many organizations structure this process.
Step 1: Define Revenue and Marketing Goals
Analytics becomes useful only when it measures outcomes that matter to the business. Companies start by defining revenue goals and identifying which marketing metrics support those goals.
Typical objectives include:
- Increasing pipeline from target accounts
- Reducing customer acquisition cost
- Improving conversion rates from lead to opportunity
Example:
A SaaS company might set a goal of generating 300 qualified leads per quarter from organic search and webinars. Marketing analytics then tracks which campaigns contribute to that target.
Step 2: Audit Marketing Data Sources
Before analyzing data, teams need to know where it lives. Most marketing organizations collect data across several systems.
Common marketing data sources include:
- CRM platforms that track leads and deals
- Advertising platforms such as Google Ads or LinkedIn Ads
- Marketing automation platforms used for email campaigns
- Website analytics tools that track visitor behavior
Integrating these systems enables companies to view the entire customer journey rather than isolated marketing interactions.
Step 3: Choose Attribution Models
Attribution determines which marketing activities receive credit for generating conversions or revenue.
Different models provide different perspectives.
First-touch attribution works best when companies want to understand which channels drive initial awareness. It is commonly used by teams focused on top-of-funnel demand generation, such as content marketing or paid acquisition.
Last-touch attribution suits organizations that want to identify which campaigns directly drove conversions. It is often used to evaluate the performance of conversion-focused channels, such as retargeting ads or demo requests.
Multi-touch attribution is more useful for B2B companies with longer sales cycles. It analyzes several interactions across the buyer journey and distributes credit among them.
Example:
A prospect may discover a company through a search result, attend a webinar, and later respond to a sales email. Multi-touch attribution helps identify the contribution of each interaction.
Step 4: Build Dashboards and Reporting
Once data sources and attribution models are defined, companies create dashboards that track performance across campaigns and channels.
Dashboards typically include metrics such as:
- Marketing-sourced pipeline
- Conversion rates across funnel stages
- Campaign performance by channel
Good dashboards make complex datasets easier to interpret through charts, graphs, and visual indicators.
Executives often use these dashboards during revenue reviews to evaluate marketing performance.
Step 5: Run Experiments and Optimize
Marketing analytics becomes powerful when teams use insights to test new ideas and improve campaign performance.
Marketing teams frequently run controlled experiments such as:
- A/ B testing of landing pages or ad creatives
- Multivariate testing of messaging and design
- Marketing experiments measuring how audiences respond to different campaigns
Marketing experimentation allows organizations to measure customer responses to different treatments and determine which approach generates better outcomes.
These experiments help teams continuously refine campaigns rather than rely on assumptions.
Also Read: How SDR Marketing Drives Success for Your Business in 2026
Common Mistakes Companies Make With Marketing Analytics
Many organizations invest in analytics tools but fail to extract meaningful insights. Most problems come from strategy gaps rather than technology limitations.
Tracking Too Many Vanity Metrics
Some marketing teams track large numbers of metrics that look impressive but do not influence revenue decisions.
Examples of vanity metrics include:
- Social media impressions
- Website traffic without conversion analysis
- Content downloads that do not lead to the pipeline
Analytics should prioritize metrics that connect marketing performance with business outcomes, such as pipeline generation or customer acquisition.
Disconnected Marketing Tools
Marketing data often lives across separate platforms that do not communicate with each other.
Common disconnects occur between:
- CRM systems and marketing automation platforms
- Website analytics tools and advertising platforms
- Product usage data and marketing engagement data
When systems operate independently, organizations cannot understand how different touchpoints influence the buyer journey.
Poor Attribution Models
Many companies rely solely on last-touch attribution. This model credits the final interaction before conversion, rather than earlier marketing influences.
This approach creates blind spots in analytics.
Example:
A prospect may read several blog posts and attend a webinar before responding to a sales email. Last touch attribution credits only the email, even though earlier interactions built interest.
Ignoring Data Quality
Analytics insights are only as reliable as the data used to generate them.
Common data quality problems include:
- Missing campaign tracking parameters
- Duplicate CRM records
- Inconsistent lead source classification
Companies that prioritize clean data usually gain more accurate insights and stronger reporting reliability.
No Action After Insights
Many organizations collect analytics data but fail to use it for decision-making.
Analytics becomes valuable only when insights influence actions such as:
- Adjusting campaign budgets
- Refining messaging and targeting
- Improving sales and marketing alignment
Organizations that treat analytics as a decision framework gain the most value from marketing data.
Marketing Analytics Trends Shaping 2026
Marketing analytics continues to evolve as technology and buyer behavior change. Several trends are reshaping how companies measure and optimize marketing performance.
AI-Driven Customer Insights
Artificial intelligence helps marketing teams analyze large datasets faster than traditional analytics tools.
AI systems can:
- Identify patterns in customer behavior
- Predict which leads are likely to convert
- Recommend campaign improvements
AI-based analytics platforms often combine machine learning with multi-touch attribution models to provide more accurate marketing insights.
Predictive Marketing Analytics
Predictive analytics uses historical data to forecast future customer behavior. Instead of analyzing what happened in the past, companies estimate what will happen next.
Applications include:
- Predicting which leads are likely to become customers
- Forecasting campaign performance
- Identifying high-value accounts
Predictive analytics models analyze historical engagement patterns to guide marketing targeting decisions.
Real Time Campaign Optimization
Traditional marketing reports often analyze campaign performance after the campaigns have finished. Modern analytics platforms provide real-time insights.
Real-time analytics enables teams to:
- Adjust ad spending while campaigns are active
- Modify messaging based on audience response
- Identify underperforming campaigns quickly
This approach improves marketing agility and reduces wasted advertising spend.
Unified Revenue Analytics Across Marketing and Sales
Revenue teams increasingly combine marketing and sales data in a single analytics framework.
Unified analytics connects:
- Marketing campaign engagement
- Sales pipeline progression
- Closed revenue metrics
Turning Marketing Insights Into Revenue Execution
Marketing analytics often identifies which campaigns generate qualified leads and pipeline. The challenge comes next. Many startups generate demand but lack enough sales capacity to convert that interest into revenue. Strong analytics can reveal opportunities, but revenue growth depends on the team executing those opportunities.
Platforms like Activated Scale help companies act on these insights by providing access to experienced US-based sales professionals.
Core support includes:
- Fractional Selling: Access experienced SDRs and Account Executives who can prospect, qualify leads, and manage sales conversations without requiring full-time hiring.
- Contract to Hire Sales Recruiting: Work with sales professionals on a trial basis and convert them into full-time hires once performance and team fit are proven.
- Fractional Sales Leadership: Engage experienced sales leaders who design sales playbooks, define GTM strategies, and build scalable sales processes.
Conclusion
A strong marketing analytics strategy turns campaign data into clear revenue decisions. When marketing signals align with CRM activity, pipeline movement, and buyer behavior, teams can identify which channels actually generate qualified demand. This visibility helps companies allocate budgets more effectively, improve targeting, and identify scalable acquisition channels.
Activated Scale helps startups convert that demand into revenue by connecting them with vetted US-based sales professionals. Explore how flexible models like fractional SDRs, fractional AEs, and contract-to-hire sales recruiting can help your team respond faster to pipeline opportunities.
FAQs
Q: How is marketing analytics different from marketing reporting?
A: Marketing reporting shows campaign metrics such as clicks or impressions. Marketing analytics goes deeper by connecting those metrics with pipeline generation and revenue outcomes. It focuses on understanding why campaigns perform well and how marketing contributes to business growth.
Q: What data sources are required to build a marketing analytics strategy?
A: Most companies combine data from website analytics tools, marketing automation platforms, advertising channels, and CRM systems. Integrating these sources helps teams track how prospects move from initial interaction to a sales opportunity and, ultimately, to revenue.
Q: How frequently should marketing analytics be reviewed?
A: Campaign dashboards are usually reviewed weekly to monitor performance trends. Strategic reviews are held monthly or quarterly to evaluate marketing ROI, pipeline growth, and channel budget allocation.
Q: Can startups implement marketing analytics with limited resources?
A: Yes. Early-stage companies often start with basic metrics such as lead conversion rates, campaign performance, and cost per lead. Even simple analytics frameworks can reveal which channels generate the most qualified demand.
Q: Why is marketing and sales alignment important for analytics?
A: Marketing analytics becomes more valuable when it tracks how leads progress through the sales funnel. Metrics such as MQL-to-SQL conversion, pipeline velocity, and opportunity win rates help both teams evaluate demand quality and prioritize revenue opportunities.
The Ultimate Guide to Hiring a Salesperson!
Get the step-by-step guide to hiring, onboarding, and ensuring success!