_edi.png)

Board meetings often expose a frustrating gap. Leadership teams arrive with CRM dashboards, pipeline reports, and forecast spreadsheets, yet directors still ask the same questions. Is revenue actually predictable? Is the pipeline strong enough for the next quarter? Where should we invest to accelerate growth?
This is exactly where a RevOps board reporting strategy becomes critical. Revenue operations integrates sales, marketing, and customer success data into a single, unified view, enabling leaders to explain performance with clarity rather than relying on scattered metrics.
The impact can be significant. A Forrester study found that companies with mature RevOps functions grow revenue nearly 3 times faster than organizations without it.
Yet many board presentations still focus on operational dashboards rather than strategic signals such as pipeline coverage, forecast accuracy, CAC efficiency, and revenue predictability.
This guide breaks down how to build a RevOps board reporting strategy, the metrics boards actually care about, and how leaders convert revenue insights into hiring and growth decisions.
Key Takeaways
- RevOps board reporting strategy focuses on revenue performance, pipeline strength, forecast reliability, and growth risks.
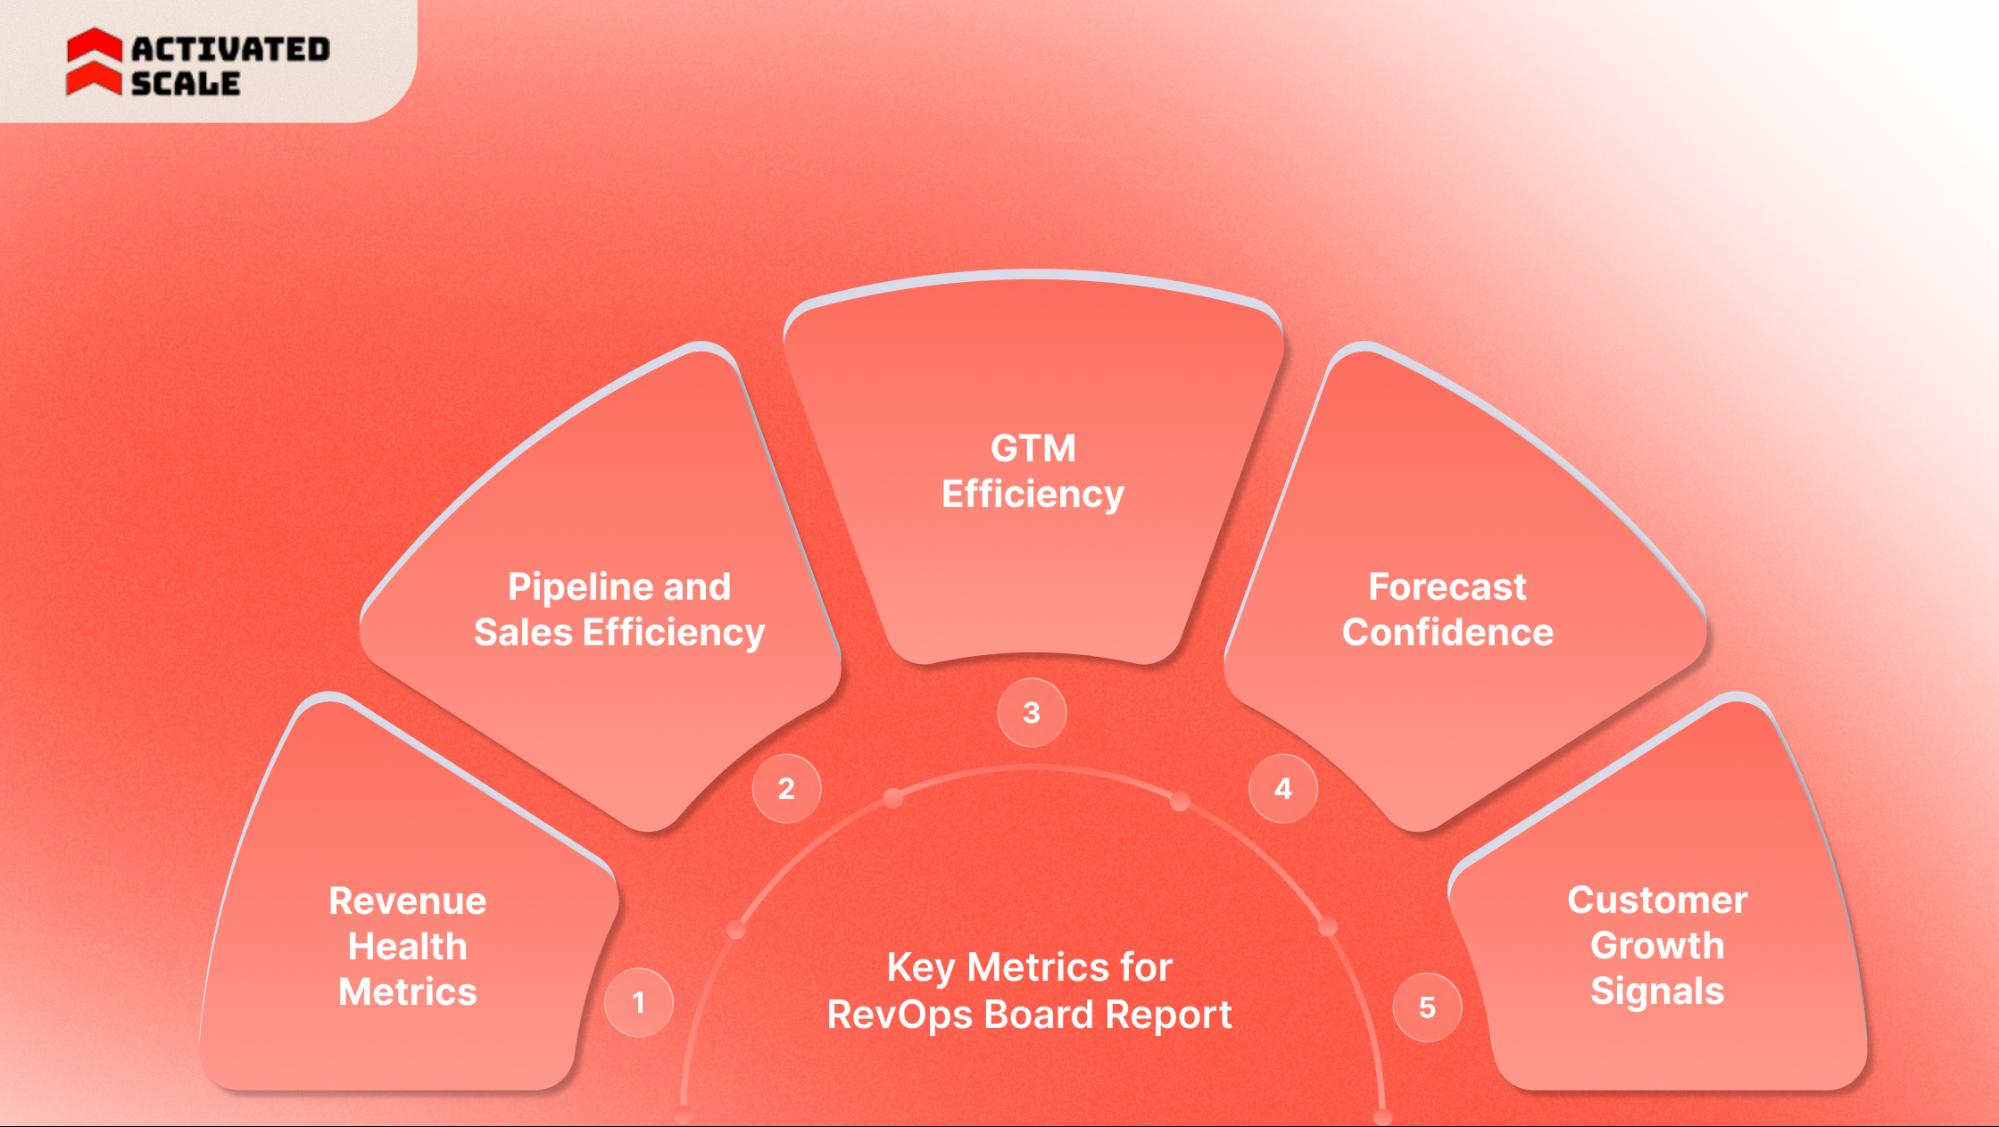
- Reports should group metrics into revenue health, pipeline efficiency, GTM efficiency, forecast confidence, and customer growth signals.
- Board reporting should highlight trends and decision signals, not operational activity metrics.
- Clear RevOps reporting helps boards make decisions on hiring, budget allocation, and GTM strategy.
- Revenue insights often reveal sales capacity gaps that require stronger execution or leadership support.
Why Board Reporting Looks Different From Internal RevOps Dashboards
A board report is not a larger version of your RevOps dashboard. It serves a different job. Internal dashboards help teams manage pipeline movement, rep activity, campaign output, and deal progression day to day.
Board reporting needs to answer a smaller set of harder questions: How reliable is growth, what is putting the plan at risk, and what should leadership do next?
Current board reporting guides consistently focus on outcomes such as revenue vs target, forecast vs actual, pipeline coverage, risk, and trends over time rather than team activity totals.
In a Forrester Consulting study, 55% of respondents said they miss their quarterly forecast by more than 10% on average, and only 18% said their quarterly forecasts land within 5% of actual revenue. That is exactly why boards keep pushing on forecast quality and revenue predictability.
For a broad audience, every metric should help answer one of these questions:
- Are results on track?
- Can leadership defend the forecast?
- What is driving risk, slowdown, or upside?
A useful test is simple. If a metric changes, would the board make a different decision on hiring, spending, market expansion, or sales coverage? If the answer is no, it likely belongs in an operating review, not a board pack.
Operational dashboards vs board level reporting
The same revenue engine can produce two very different reports. One helps operators manage execution. The other helps directors judge performance and make capital decisions.
The distinction is not cosmetic. It changes the discussion in the room. A dashboard that says “1,200 leads generated” creates a follow-up question. A board report that says “Pipeline coverage fell from 3.4x to 2.6x in the mid market segment, putting Q3 at risk” creates a decision.
That is where the RevOps board reporting strategy needs discipline. It should translate operating data into board-level signals, such as:
- Pipeline coverage ratio
- Forecast variance
- Win rate trend by segment
- Sales cycle movement
- CAC trend
- Retention and expansion trend
- Capacity gap by region, product line, or channel
The three questions every board asks
Most board discussions come back to three issues. Your report should answer them before anyone asks.
Are we growing efficiently?
Growth without discipline raises concerns fast. Boards want to see whether revenue gains are supported by sensible acquisition cost, retention quality, and productive use of headcount.
Is revenue predictable?
A big pipeline does not calm a board if close dates keep slipping or forecast confidence keeps changing. This is where variance analysis, deal slippage, and commit accuracy matter more than raw opportunity volume.
Are we investing in the right GTM motion?
Boards want proof that spend is moving into the right channels, segments, and roles. A strong report shows where growth is coming from and where the model is getting weaker.
One practical format is to open the board section with a three-line snapshot:
- Revenue pace vs plan
- Forecast confidence for the current and next quarter
- Top two risks and top two upside drivers
That gives the board direction before you show supporting detail.
Also Read: Step-by-Step GTM Strategy for SaaS Companies
What Metrics Belong in a RevOps Board Report
Many people mix board metrics with operating KPIs. That creates clutter. Board reporting should stay focused on performance, predictability, efficiency, and risk.
The metric set below is broader than a software company lens, so it works for B2B services, tech, marketplaces, industrial firms, financial services, and other revenue-driven businesses.
A useful rule is to group metrics by the decision they support. That keeps the report sharp and speeds up the discussion.
1. Revenue health metrics
These metrics show whether the business is actually growing in a durable way.
Use this section to answer: What happened to revenue, and how healthy is that movement?
Key metrics to include:
- Revenue growth rate – overall revenue momentum
- Recurring revenue growth – predictable income expansion
- Retention or renewal rate – customer continuation level
- Expansion revenue – growth from existing accounts
- Gross churn – customers or revenue lost
- Net revenue movement – total growth after churn
- Revenue mix – growth by segment or region
Do not stop at the topline number. Add one sentence that explains the driver. For example:
- Revenue grew 14% year over year, but 60% of the lift came from price increases rather than new customer volume.
- Expansion revenue improved, but gross churn in one segment offset much of the gain.
- Growth remained flat even as the pipeline rose, suggesting a conversion or cycle-length issue.
That extra line gives the board something to act on.
2. Pipeline and sales efficiency
This section shows if the future revenue base is strong enough to support the plan.
Use it to answer: Do we have a high-quality pipeline, and is it moving quickly enough to support the next quarter?
Key metrics to include:
- Pipeline coverage ratio – pipeline vs revenue target
- Qualified pipeline value – sales-ready opportunities
- Win rate – deals successfully closed
- Average sales cycle – time from lead to close
- Pipeline velocity – speed of pipeline movement
- Deal slippage rate – deals pushed to later periods
- Stage conversion rate – movement between sales stages
- Average deal size – revenue per closed deal
3. GTM efficiency
This section explains to the board the effort and cost required to generate revenue.
Use it to answer: Is the company spending wisely to generate growth?
Key metrics to include:
- Customer acquisition cost – cost to acquire a customer
- LTV to CAC ratio – value vs acquisition cost
- Payback period – CAC recovery time
- Marketing-sourced pipeline – demand from marketing
- Sales productivity per rep – revenue per salesperson
- Revenue per headcount – revenue per employee
- Channel efficiency – performance by sales channel
This is where many board reports get weak. They show spending and revenue separately, but they do not connect the two. The board needs the connection.
For example:
- CAC rose 18% in the enterprise segment, but the win rate stayed flat.
- Paid acquisition drove more leads, but partner-sourced pipeline converted faster.
- Revenue per quota-carrying rep improved after territory changes, not after a budget increase.
These statements help directors judge whether the current go-to-market design is worth extending.
4. Forecast confidence
This is the section that often decides how much trust the board puts in the rest of the report.
Use it to answer: How close is the forecast likely to be, and where is the risk concentrated?
Key metrics to include:
- Forecast accuracy – forecast vs actual revenue
- Commit vs best case – forecast confidence range
- Deal slippage – deals missing expected close dates
- Quarter coverage ratio – pipeline supporting forecast
- Forecast variance – difference by region or team
- Weighted pipeline value – probability-adjusted revenue
The evidence here is sobering. In the same Forrester Consulting study, more firms were off by 20% or more than were within the ideal 5% range, and only a small minority were tightly accurate.
That means a board should not see one forecast number in isolation. It should see the confidence around that number.
5. Customer growth signals
Revenue quality does not stop at closed deals. Boards also need signs of retention strength and future account value.
Use this section to answer: Are customers staying, expanding, and getting value at a level that supports future growth?
Key metrics to include:
- Retention rate – customers continuing contracts
- Expansion rate – growth within existing accounts
- Cross-sell revenue – additional product adoption
- Product adoption milestones – usage growth signals
- Renewal timing risk – contracts nearing renewal
- Revenue concentration – reliance on major accounts
- Customer health score – overall account stability
When growth signals indicate a capacity gap in sales execution or account expansion, companies often quickly bring in experienced sales talent. Activated Scale connects businesses with vetted US-based SDRs, AEs, and fractional sales leaders who can step in to strengthen pipeline growth and deal execution.
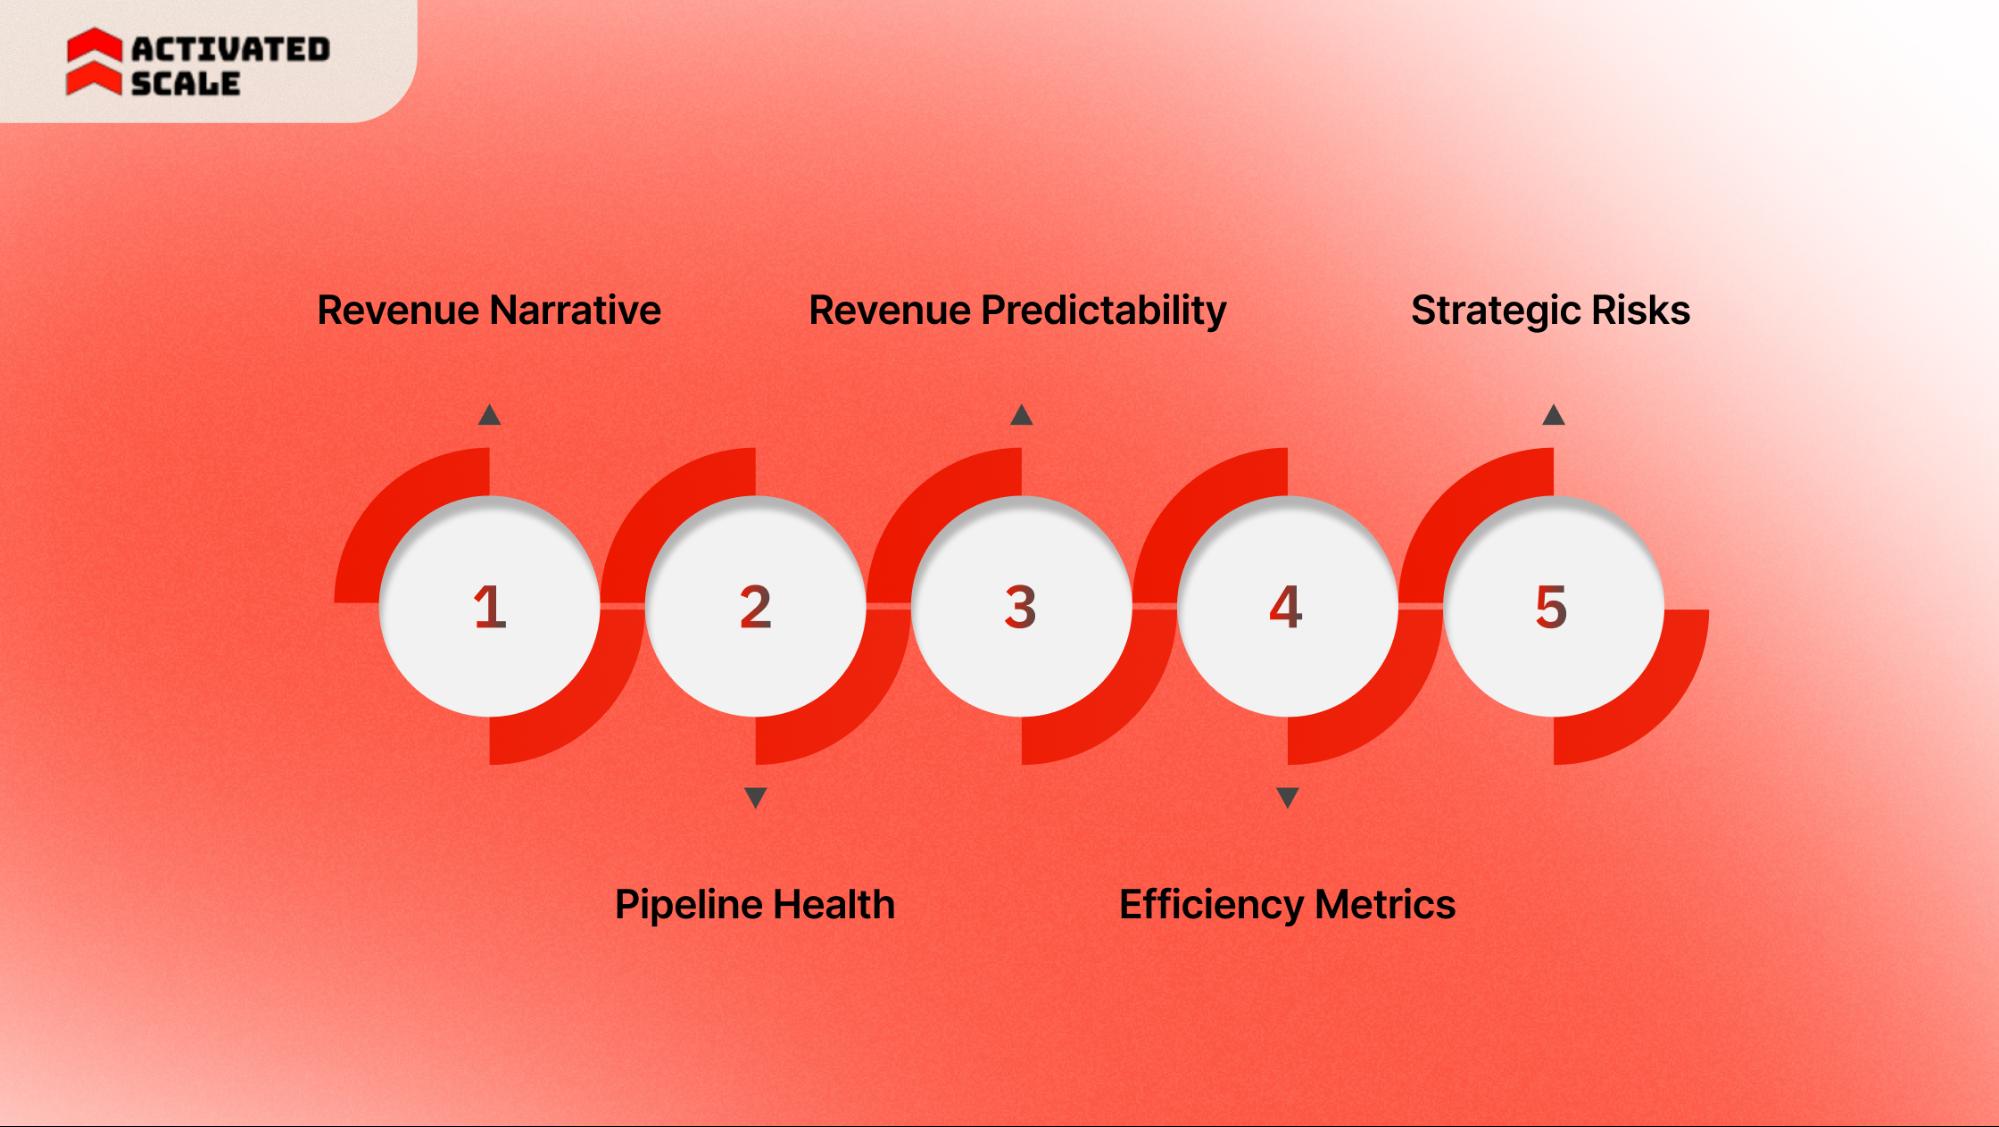
How to Structure a RevOps Board Report
A strong board report is built like a decision memo, not a data dump. The goal is to move from what happened to why it happened to what leadership should do next.
This structure works well across industries and keeps the conversation focused.
1. Revenue narrative
Open with a short narrative before showing detailed metrics. This should explain the quarter in plain language.
Use three parts:
- What changed
- Why it changed
- What does it mean next
Example:
Revenue finished 6% below plan. The shortfall came mostly from later-stage deal slippage in the direct channel, while partner-sourced business stayed on pace. Next-quarter coverage remains healthy, but the close-date risk in large accounts needs closer inspection.
This helps the board enter the metric pages with context rather than trying to infer the story from charts.
2. Pipeline health
After the revenue narrative, show whether the pipeline supports the next period.
Cover three issues:
- Coverage against the target
- Conversion quality
- Timing risk
A clean way to show it:
- Current quarter coverage ratio
- Next quarter, early coverage
- Win rate trend over the last four quarters
- Sales cycle movement
- Slipped deals from the prior quarter to the current quarter
This section should not read like a CRM export. It should show what is strengthening and what is weakening.
3. Revenue predictability
This is where you prove the forecast can be trusted.
The page should include:
- Forecast vs actual for recent quarters
- Current commit and best case
- Variance by team, region, or segment
- The largest assumption behind the number
The board does not need every deal. It needs a clear view of how stable the forecast process is.
For example:
Forecast accuracy improved from a 14% miss to a 6% miss over two quarters after stricter deal inspection rules. The remaining volatility is concentrated in one region where the average cycle length has increased, and commitment discipline remains weak.
That tells the board the problem and the source.
4. Efficiency metrics
After revenue and forecast confidence, move into efficiency. This connects operating performance to capital use.
Include:
- CAC trend
- Revenue per rep or per commercial head
- Channel efficiency
- Payback period
- Cost to acquire and retain key account segments
5. Strategic risks
Close the board reporting section with risks and recommended actions. This part is often missing from weak reports.
Boards want to know what could break the plan before it breaks.
Focus on a short list such as:
- Pipeline concentration in a few large deals
- Regional softness
- Longer approval cycles
- Retention pressure in one customer segment
- Gaps in sales capacity or leadership coverage
- Data quality issues affecting forecast confidence
Then add the response. Example:
Pipeline concentration has risen to 42% in the top ten deals. Leadership is tightening inspection on those accounts and adjusting next quarter coverage targets by segment to reduce exposure.
Also Read: Best Outbound Sales Tools for Software Teams in 2026
What Most RevOps Board Reports Get Wrong
Many RevOps reports fail at the board level because they present operational information instead of decision signals. Board members review company performance across strategy, finance, and risk.
They expect reports that highlight performance trends, strategic risks, and resource implications, not activity dashboards.
Below are the most common mistakes that weaken board-level RevOps reporting.
Too many metrics
Large dashboards dilute insight. Executive reporting works best when it highlights only a small group of high-impact indicators rather than dozens of charts.
Focus the report on a limited set of decision metrics.
Examples of board-relevant signals:
- Revenue growth trend
- Pipeline coverage against next quarter targets
- Forecast reliability
- Customer acquisition cost efficiency
- Revenue concentration risk
When these signals are clear, the board can quickly assess performance without having to scan large operational dashboards.
No defined metric ownership
Metrics without owners rarely improve. If a KPI moves in the wrong direction, leadership must know who is responsible and what corrective action follows.
A board-ready report links every critical metric to an accountable leader and a response plan.
This structure converts metrics into operational accountability.
Lack of trend context
A single quarter rarely tells the full story. Board members evaluate patterns across time before judging performance.
Strong reports present metrics across multiple periods, such as:
- Last four quarters
- Year-over-year comparison
- Forecast vs actual results
- Pipeline movement across stages
Operational details instead of strategic signals
Boards do not need the same activity metrics teams use for daily management. They need signals that explain business performance and risk.
The difference is impact. Activity metrics describe work. Strategic metrics explain outcomes.
How RevOps Data Helps Boards Make Hiring Decisions
Board reporting is not only about reviewing performance. It shapes hiring and resource allocation decisions across the organization. Revenue data reveals where the growth engine is constrained and where additional capacity is required.
When pipeline growth exceeds sales capacity
Strong pipeline growth can expose a capacity gap. If qualified opportunities increase faster than the team’s ability to manage them, conversion rates decline, and deals slip into future quarters.
Common signals include:
- Rising pipeline coverage with flat win rates
- Longer deal cycles
- Increasing backlog of late-stage opportunities
Boards often respond by recommending additional sales capacity, territory changes, or leadership support to protect forecast accuracy.
When pipeline quality drops
Pipeline volume alone does not guarantee revenue. Boards closely monitor conversion rates and stage velocity to determine whether pipeline quality is improving or declining.
Indicators of pipeline quality issues include:
- High lead volume with weak qualification
- Falling conversion between stages
- High early-stage opportunity loss
In these cases, leadership may adjust demand generation strategy, qualification criteria, or SDR workflows rather than increasing sales headcount.
When revenue growth slows despite strong demand
A revenue slowdown can sometimes signal an execution problem rather than weak demand. Pipeline may remain strong, yet deals fail to close efficiently.
Typical signals include:
- Stable pipeline coverage but declining win rate
- Forecast slippage across multiple quarters
- Deal cycles are expanding beyond expected ranges
Boards often respond by examining the quality of the sales process, pricing strategy, and leadership oversight.
How companies close sales capacity gaps
Hiring experienced sales professionals quickly can be difficult, especially when organizations need proven operators rather than entry-level hires.
Many companies solve this challenge through flexible hiring models:
- Fractional sales leadership
- Contract-based sales development teams
- Interim account executives during expansion phases
Platforms like Activated Scale connect companies with pre-vetted US-based SDRs, AEs, and fractional sales leaders who can help expand pipeline coverage and improve deal execution while internal hiring plans continue.
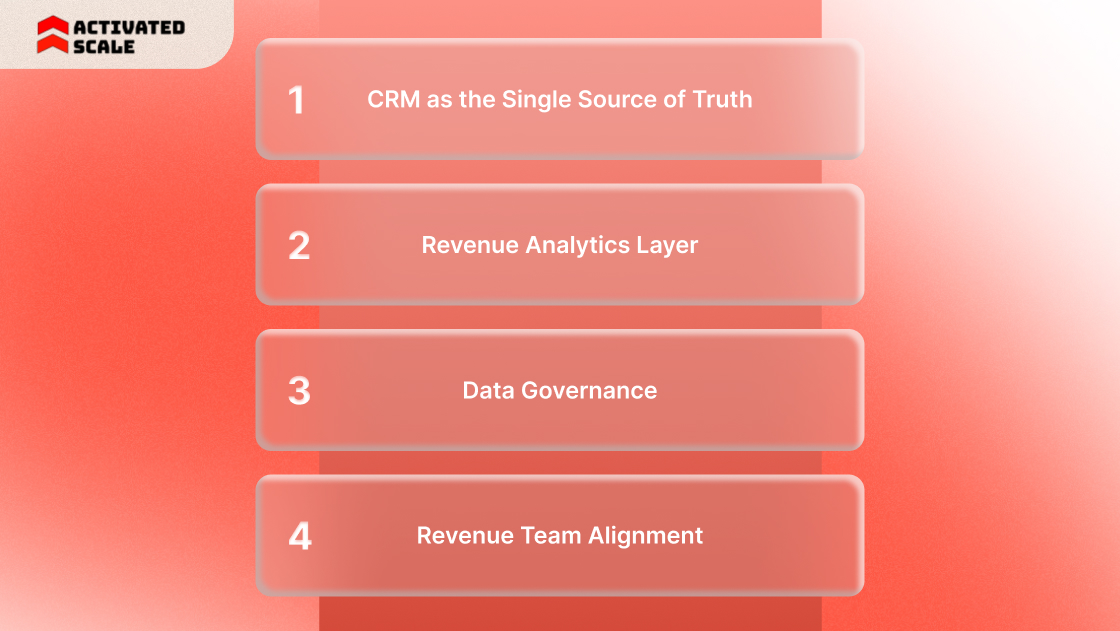
Building a RevOps Reporting Stack That the Board Trusts
Reliable board reporting depends on a strong data infrastructure. When metrics come from disconnected systems or inconsistent definitions, the board quickly questions the report's accuracy.
A structured reporting stack helps maintain credibility.
CRM as the single source of truth
Customer relationship management platforms remain the foundation of revenue reporting.
Common systems include:
- Salesforce
- HubSpot
These platforms store pipeline data, deal stages, account activity, and revenue attribution. When configured properly, they allow RevOps teams to track conversion patterns, deal velocity, and revenue trends across the organization.
Revenue analytics layer
CRM data alone rarely answers board-level questions. Many organizations add analytics tools that aggregate and interpret revenue data across marketing, sales, and finance systems. These tools transform raw pipeline activity into executive-level insights used in board reporting.
Examples include:
- Clari – Forecasting and revenue intelligence platform used to track pipeline health, deal progress, and forecast accuracy.
- Gong – Revenue intelligence tool that analyzes sales conversations and pipeline signals to identify deal risks and conversion patterns.
- InsightSquared – Revenue analytics platform focused on pipeline analytics, forecasting, and sales performance reporting.
- Tableau or Looker – Business intelligence tools used to combine CRM, marketing, and financial data into executive dashboards.
These systems combine pipeline, marketing, and financial signals into board-level metrics, including forecast reliability, pipeline coverage, deal velocity, and conversion trends.
Data governance
Data accuracy determines whether leadership trusts the report. Governance processes maintain consistent definitions across teams.
Examples of governance controls:
- Standard deal stage definitions
- Unified revenue attribution models
- Consistent account segmentation
- Automated data validation rules
Without these controls, pipeline and forecast numbers become unreliable.
Alignment across revenue teams
RevOps exists to align marketing, sales, and customer success around shared revenue goals. When each department tracks its own metrics independently, board reporting becomes fragmented.
Unified reporting connects the full revenue lifecycle:
- Marketing pipeline generation
- Sales conversion and deal execution
- Customer retention and expansion
This integrated view allows leadership and board members to see how each stage of the revenue system influences overall growth.
Strengthening Sales Execution When Revenue Signals Show Gaps
Board reporting often highlights execution gaps. Pipeline may grow, forecasts may tighten, or expansion revenue may stall. These signals usually point to capacity issues in sales coverage, pipeline generation, or leadership oversight. Addressing them quickly becomes critical to protect revenue targets.
This is where flexible sales hiring models help. Activated Scale connects companies with vetted US-based sales professionals who can support revenue growth without long hiring cycles.
Key services include:
- Contract to hire sales recruiting: Test experienced reps before committing to full-time hires.
- Fractional SDRs and AEs: Expand pipeline generation and manage deal cycles during growth phases.
- Fractional sales leadership: Experienced VPs of Sales who design GTM strategy, forecasting processes, and sales playbooks.
Conclusion
A clear RevOps board reporting strategy helps leadership move beyond dashboards and focus on decisions that affect growth. Board reports should highlight revenue momentum, pipeline strength, forecast reliability, and customer expansion signals. When these indicators are structured well, boards can quickly understand where performance is strong and where the business needs attention.
The real value of RevOps reporting lies in metrics that drive action. Pipeline gaps may reveal the need for additional sales coverage. Forecast risk may signal process issues or leadership gaps. These insights often shape hiring and go-to-market decisions.
If you need experienced sales professionals without committing to full-time headcount, Activated Scale connects you with vetted US-based SDRs, AEs, and fractional sales leaders.
Build a repeatable sales process, reduce ramp time, and scale your GTM team without the risk of early-stage hiring mistakes.
FAQs
Q: How often should RevOps data be shared with the board?
A: Most companies review RevOps insights during quarterly board meetings. Internal leadership teams usually track the same metrics monthly to monitor pipeline movement, forecast changes, and revenue pacing. This structure helps boards evaluate trends rather than isolated data points.
Q: What makes a board report different from a sales dashboard?
A: Sales dashboards track daily activity such as calls, demos, or deals in progress. Board reports focus on broader signals like revenue momentum, pipeline coverage, and forecast reliability. The goal is to help directors assess business performance and future growth risk.
Q: Why is pipeline coverage important in board reporting?
A: Pipeline coverage shows whether there are enough qualified opportunities to support upcoming revenue targets. Weak coverage may signal future revenue pressure even if current results look strong. Boards use this metric to evaluate sales capacity and demand strength.
Q: Who usually owns RevOps board reporting?
A: RevOps leaders typically coordinate the report because they manage revenue data across marketing, sales, and customer success. Finance teams often validate revenue numbers and forecasting assumptions. This collaboration creates a unified revenue view for the board.
Q: What is the biggest mistake in RevOps reporting?
A: Many reports include too many operational metrics that distract from strategic signals. Board members care more about revenue trends, forecast confidence, and pipeline health. Clear reports prioritize a small set of decision-focused metrics.
The Ultimate Guide to Hiring a Salesperson!
Get the step-by-step guide to hiring, onboarding, and ensuring success!