_edi.png)
Sales teams don't miss targets because they lack effort. They miss them because execution breaks down in ways that aren't always obvious.
Pipelines look full, forecasts feel optimistic, and activity stays high, yet revenue remains unpredictable. The gap usually stems from tracking the wrong signals or the right ones without clear ownership.
That's where sales operations KPIs matter. When chosen carefully, they explain how deals move, where momentum stalls, and why results vary from quarter to quarter. More importantly, they help teams shift from reactive fixes to deliberate improvement.
In a nutshell
- Sales operations KPIs go beyond activity tracking and focus on deal quality, efficiency, and predictability.
- Metrics like ACV, CLV, pipeline velocity, and conversion rate explain why revenue grows or stalls.
- Pipeline aging, response time, and ramp time expose execution gaps early, before targets are missed.
- Rep retention and customer retention are operational KPIs that directly impact revenue stability.
- KPIs only drive results when teams have the ownership and capacity to act on the data.
What Sales Operations KPIs Measure
Sales operations KPIs track how effectively your sales process runs, not just how much revenue it produces. They focus on execution, efficiency, and consistency across the funnel.
These metrics show how leads convert, how long deals take to close, and where effort is being wasted. Common sales ops KPIs include conversion rate, average deal size, sales cycle length, and revenue growth.
Used correctly, these KPIs surface bottlenecks early and keep teams aligned on the same definitions. They support better decisions around process, resources, and priorities, helping sales performance scale with greater predictability.
Why Sales Operations KPIs Are Critical to Performance
Sales operations KPIs are designed to show whether your revenue engine is working as intended. Without them, teams rely on instinct, which makes it harder to spot problems early or fix them with confidence.
The real value of sales ops KPIs comes from quantifying how work flows through your sales system. For example, tracking sales cycle length doesn't just show how long deals take; it also helps pinpoint where momentum slows and why.
Well-chosen KPIs help teams:
- Identify bottlenecks in qualification, handoffs, approvals, or follow-ups
- Evaluate process effectiveness using evidence, not anecdotal feedback
- Allocate resources more deliberately, based on what drives progress
- Prioritize fixes that improve execution instead of reacting late in the quarter
KPIs are most useful when viewed together. Looking at multiple sales operations metrics in context, rather than in isolation, gives leaders a clearer picture of overall performance and trade-offs.
Used consistently, sales operations KPIs support better decisions, tighter execution, and more predictable outcomes as teams scale.
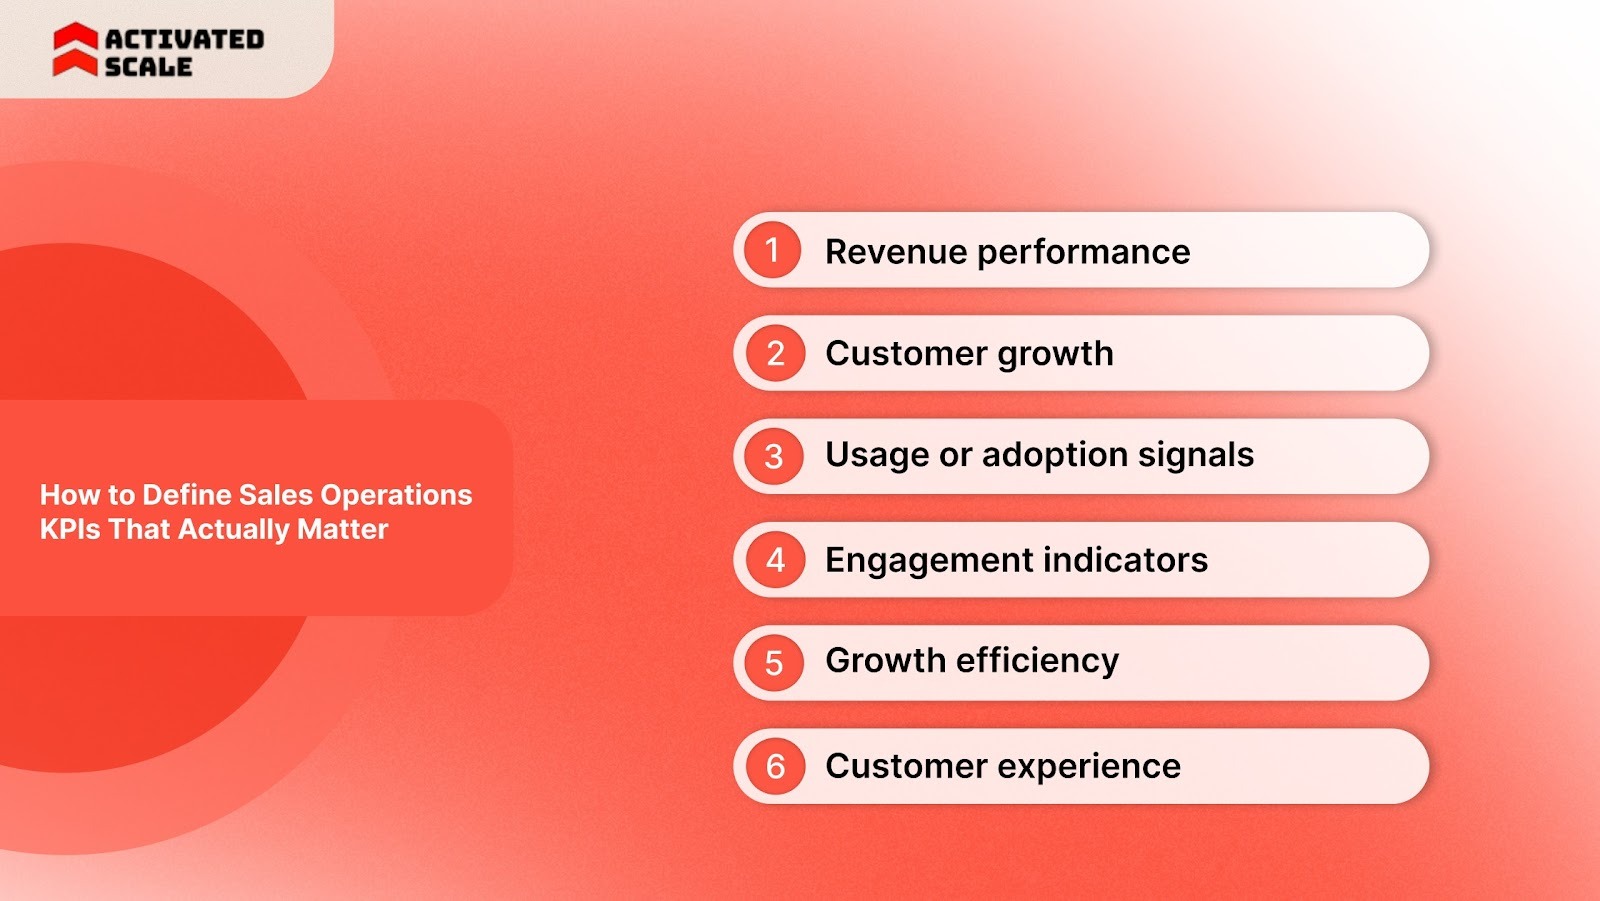
How to Define Sales Operations KPIs That Actually Matter
Choosing sales operations KPIs isn't about tracking everything you can measure. It's about deciding which signals of progress are clear and early enough to act on.
A practical way to do this is to anchor your KPIs to a North Star metric, one core indicator that reflects how effectively your sales system drives growth. Supporting metrics still matter, but they should explain why the North Star is moving, not compete with it.
In sales operations, this usually means organizing KPIs into a small set of outcome-driven categories:
- Revenue performance: Metrics such as Monthly Recurring Revenue (MRR) and annual revenue indicate whether sales execution is translating effort into results.
- Customer growth: Tracking new customers or paid accounts helps sales ops understand pipeline health and demand capture.
- Usage or adoption signals: For SaaS teams, usage trends often surface sales-quality issues earlier than revenue alone.
- Engagement indicators: Metrics such as DAU or MAU can highlight whether customers are activating as expected after purchase.
- Growth efficiency: CAC, LTV-to-CAC ratio, and buying frequency reveal whether growth is sustainable, not just fast.
- Customer experience: NPS and CSAT help sales ops spot friction that may slow renewals or expansion later.
The key isn't the number of KPIs. It's alignment. When metrics ladder up to a clear North Star, sales operations can diagnose problems faster and adjust execution before gaps widen.
Sales Operations KPIs That Matter for Predictable Revenue
Sales operations KPIs should do more than describe activity. They should explain why revenue behaves the way it does, where execution breaks down, and which levers actually improve outcomes over time.
The KPIs below focus on deal quality, pipeline health, and long-term value, not just short-term wins.
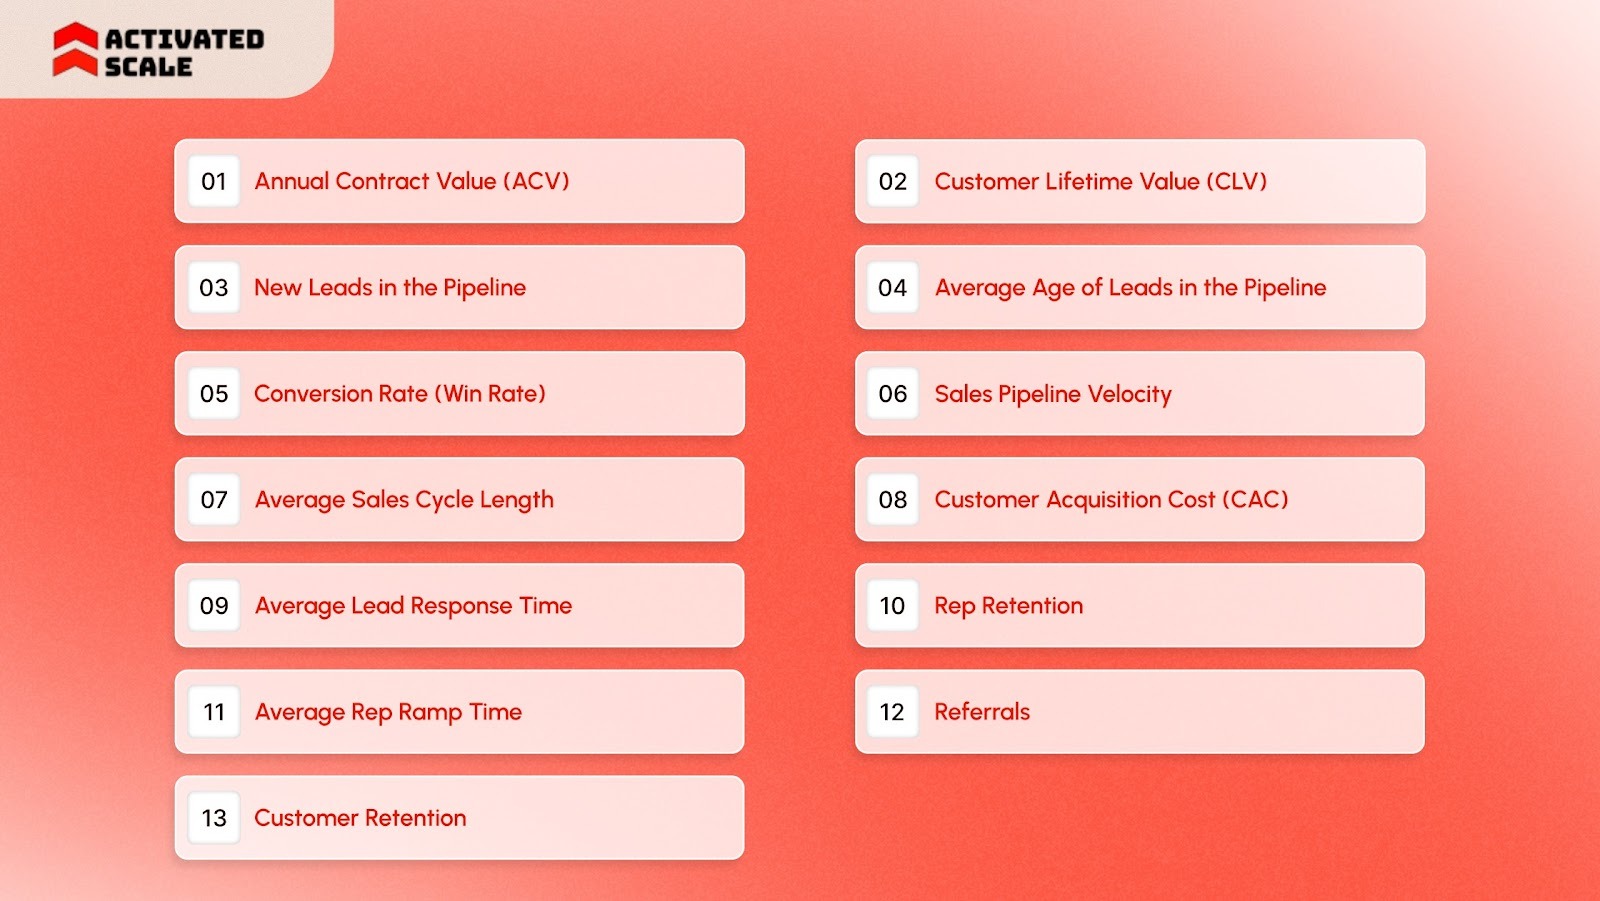
1. Annual Contract Value (ACV)
Annual Contract Value represents the average revenue generated per customer contract over a one-year period. It reflects the annual revenue each deal contributes.
ACV helps sales teams determine whether growth is driven by volume or value. A rising ACV often signals successful upselling or cross-selling, while a declining ACV may indicate misaligned targeting or pricing pressure. Even when total revenue grows, flat or shrinking ACV can expose future risk.
How sales ops uses it:
Sales operations teams track ACV by segment, product, and rep to identify where expansion opportunities exist and where deal quality is weakening. If ACV remains low and upsells aren't viable due to product or pricing constraints, the focus may need to shift toward acquiring higher-value customers.
Example:
If a company closes $1,200,000 in contract value across 100 customers in a year, the ACV is $12,000. This gives leadership a baseline for revenue planning and pipeline coverage expectations.
2. Customer Lifetime Value (CLV)
Customer Lifetime Value estimates the total revenue a customer generates over the entire duration of their relationship with your company, including renewals, upsells, and cross-sells.
CLV reflects the strength of customer relationships built by sales, not just the initial close. Higher CLV indicates trust, relevance, and the delivery of long-term value. Low CLV often points to poor qualification, weak handoffs, or misaligned expectations early in the sales cycle.
How sales ops uses it:
Sales ops teams compare CLV against CAC to understand whether growth is sustainable. They also analyze CLV by cohort to identify which segments and sales motions drive durable revenue, not just short-term wins.
Example:
If the average customer spends $200 per purchase, buys five times per year, and stays for three years, the CLV is $3,000. This metric helps teams justify investment in retention and expansion strategies.
3. New Leads in the Pipeline
This KPI tracks the number of new leads added to each sales rep's pipeline over a defined period, usually quarterly.
Pipeline volume determines whether future revenue targets are achievable. Even strong conversion rates can't compensate for an insufficient number of qualified leads entering the system. A consistent shortfall usually points to prospecting gaps or weak alignment between marketing and sales.
How sales ops uses it:
Sales operations sets minimum pipeline coverage targets based on historical conversion rates. When lead volume drops below these thresholds, teams can identify early that future quarters are at risk and adjust their prospecting or demand-generation efforts.
Example:
If a team typically closes four deals for every seven qualified leads, they can calculate the number of leads required to hit quota. Falling short signals a pipeline problem long before revenue misses occur.
4. Average Age of Leads in the Pipeline
This KPI calculates how long leads remain active in the pipeline without closing, usually tracked at the rep level.
A full pipeline isn't healthy if deals aren't moving. Aging often indicates poor qualification, stalled follow-ups, or unclear next steps. Over time, stale opportunities distort forecasts and drain rep productivity.
How sales ops uses it:
Sales operations teams monitor aging trends to identify reps or segments where deals consistently stall. Regular pipeline cleanup and review cadences help teams refocus effort on opportunities that are more likely to close.
If the total age of all active deals for a rep is 600 days across 20 opportunities, the average age is 30 days. Spikes beyond the normal cycle length are a clear warning sign.
5. Conversion Rate (Win Rate)
Conversion rate, often called win rate, tracks the percentage of opportunities that turn into closed deals within a given period.
Win rate reveals how effectively your team turns interest into revenue. A strong pipeline means little if deals consistently fail to close. Changes in win rate often signal shifts in messaging quality, qualification standards, or sales execution.
How sales ops uses it:
Sales operations teams analyze win rate by rep, segment, deal size, and source. High-performing reps often reveal repeatable behaviors or messaging that can be standardized. Declining win rates usually trigger reviews of qualification criteria or enablement gaps.
Example:
If a rep closes 30 deals out of 100 opportunities in a quarter, their win rate is 30%. Comparing this across reps helps identify best practices and early execution issues.
6. Sales Pipeline Velocity
Pipeline velocity calculates how quickly revenue moves through the sales pipeline, combining deal volume, win rate, deal size, and sales cycle length into a single metric.
This KPI integrates multiple performance levers into a single view of sales efficiency. Even with strong deal volume, slow velocity can delay revenue and increase forecasting risk. Improving velocity often has a bigger impact than simply adding more leads.
How sales ops uses it:
Sales ops teams use pipeline velocity to identify bottlenecks across the funnel. If velocity slows, they can pinpoint whether the issue lies in conversion, deal size, or cycle length and act accordingly.
Example:
If a team has $500,000 in opportunities, a 20% win rate, an average deal size of $10,000, and a 30-day sales cycle, pipeline velocity equals $33,333 per day. This shows the daily revenue generated by the pipeline.
7. Average Sales Cycle Length
This KPI measures the average number of days required to close a deal from first contact to final agreement.
Long sales cycles increase CAC and delay revenue realization. They can also hide deeper issues such as unclear buyer criteria, weak follow-ups, or internal approval delays. Shorter, more consistent cycles improve predictability.
How sales ops uses it:
Sales operations monitors cycle length by segment and deal type to understand where friction occurs. Changes over time help teams assess whether process improvements or enablement initiatives are working.
Example:
If five deals close in 20, 25, 30, 35, and 40 days, the average sales cycle length is 30 days. Significant deviations from this baseline require investigation.
8. Customer Acquisition Cost (CAC)
CAC calculates the total cost of acquiring a new customer, including sales and marketing expenses.
CAC keeps growth grounded in efficiency. Rising CAC without corresponding increases in deal size or CLV signals wasted spend or poor targeting. Sustainable growth depends on maintaining a healthy balance between acquisition cost and customer value.
How sales ops uses it:
Sales ops teams track CAC alongside conversion and velocity metrics to understand where efficiency breaks down. CAC trends often inform decisions around channel mix, sales motion, and headcount planning.
Example:
If a company spends $50,000 on sales and marketing in a month and acquires 100 new customers, the CAC is $500 per customer.
9. Average Lead Response Time
Average lead response time tracks how quickly sales reps respond to new inbound leads after they enter the pipeline.
Speed directly affects conversion. Leads contacted quickly are more likely to engage, while delays often result in lost interest or competitor wins. Slow response time is usually a process issue, not a rep effort problem.
How sales ops uses it:
Sales operations monitors response time across reps and lead sources to identify routing gaps or workload imbalance. Improving response time often requires clearer ownership, automation, or better prioritization rules.
Example:
If reps respond to leads in 10, 15, 20, 25, and 30 minutes, the average response time is 20 minutes. Longer averages highlight immediate execution friction.
10. Rep Retention
Rep retention shows the percentage of sales reps who remain with the company over a defined period, typically measured annually.
High turnover disrupts customer relationships, resets pipelines, and increases onboarding costs. Strong retention signals stable processes, realistic quotas, and effective enablement.
How sales ops uses it:
Sales ops teams analyze retention alongside performance and ramp data to understand whether churn is driven by hiring fit, onboarding gaps, or execution pressure.
Example:
If a team starts the year with 20 reps, hires 5 new reps, and ends the year with 18, retention is calculated using the original cohort to assess stability.
11. Average Rep Ramp Time
This KPI tracks how long it takes a new sales rep to reach meaningful productivity, from day one to first prospect outreach or first deal activity.
Long ramp times delay revenue and strain existing teams. A faster ramp indicates strong hiring signals, effective onboarding, and clear processes.
How sales ops uses it:
Sales operations tracks ramp time by role and segment to refine onboarding programs and identify where enablement falls short.
Example:
If five new reps take 30, 35, 40, 45, and 50 days to begin prospecting, the average ramp time is 40 days.
12. Referrals
Referrals track the number of new opportunities generated through existing customers.
Referrals shorten sales cycles and increase close rates because trust already exists. They also signal strong post-sale relationships and product satisfaction.
How sales ops uses it:
Sales ops monitors referral volume to understand customer advocacy and identify reps who consistently build long-term value rather than short-term wins.
Example:
If a rep generates five referral-based opportunities in a quarter, those deals typically move faster and close at higher rates than cold-sourced leads.
13. Customer Retention
Customer retention is the percentage of customers who continue to buy over time. Its inverse is churn.
Retention underpins predictable revenue. Losing customers forces teams to rely on constant acquisition, increasing pressure on CAC and pipeline volume.
How sales ops uses it:
Sales ops teams review retention alongside CLV and handoff quality to identify where expectations are not met post-sale and where process improvements are needed.
Example:
If a company starts the year with 500 customers and ends with 520 after acquiring 80 new customers, retention is calculated to assess how many existing customers were retained.
For teams that need experienced support turning these KPIs into action, platforms like Activated Scale make it easier to bring in proven sales operators without committing before the motion is clear.
Also read: Sales compensation plans for startups
Turning Sales Ops KPIs Into Action
Sales operations KPIs only create value when someone is responsible for acting on them. Seeing pipeline slow down or ramp time increase is useful, but without the right execution support, those signals don't change outcomes.
Many teams hesitate to hire full-time too early, even when KPIs clearly point to capacity or leadership gaps. That's where Activated Scale fits naturally into a KPI-driven sales ops approach.
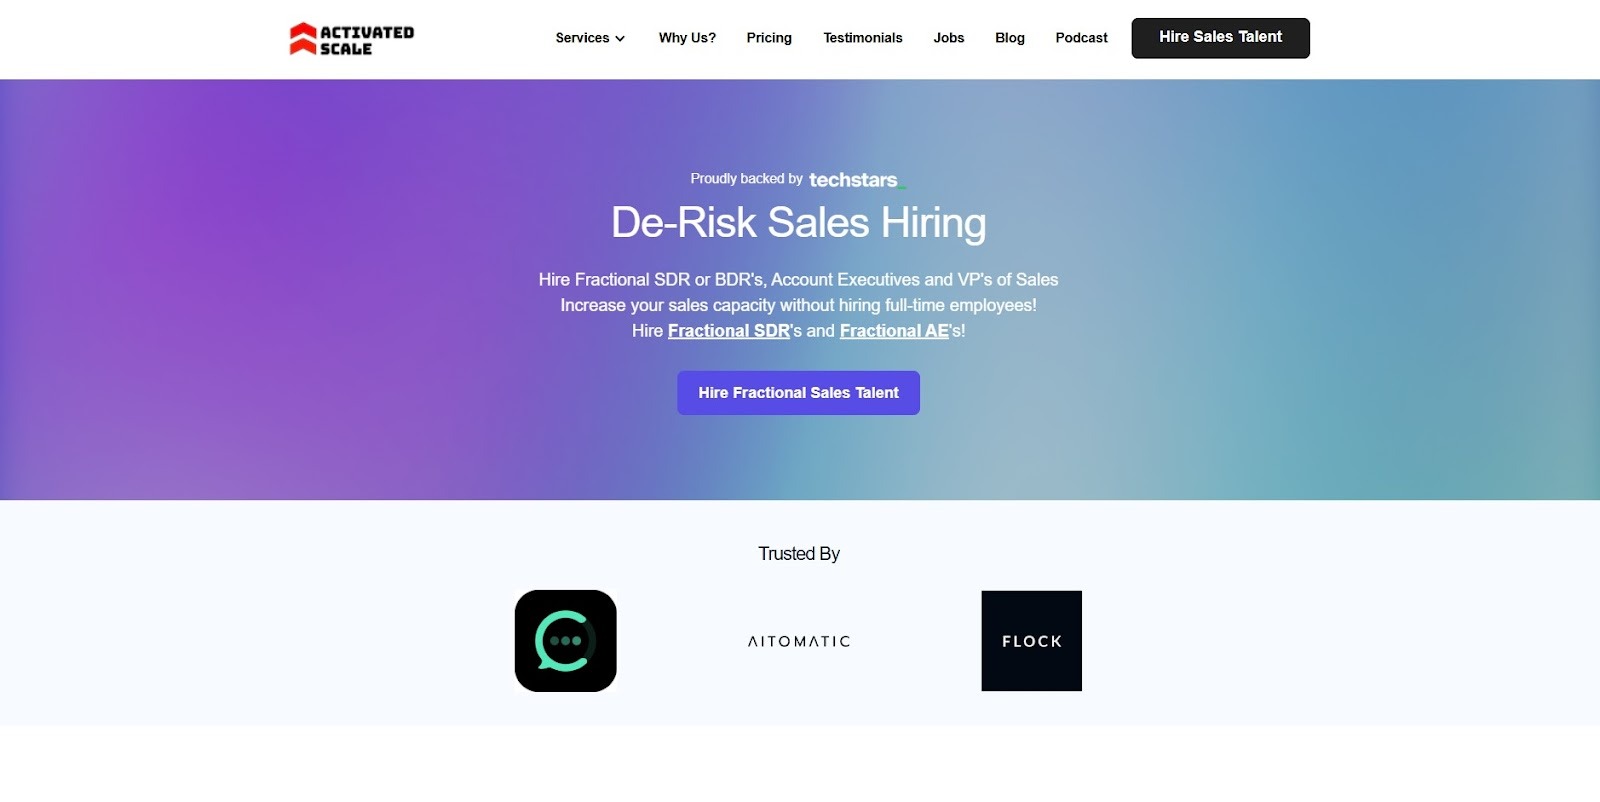
Activated Scale gives teams flexible access to experienced sales professionals who can respond to what the data is showing:
- Contract-to-Hire Sales Recruiting to address ramp time, rep retention, and conversion gaps without early commitment.
- Fractional Selling to support pipeline coverage, response time, and velocity when lead flow outpaces capacity.
- Fractional Sales Leadership to bring ownership and discipline to forecasting, pipeline hygiene, and execution consistency.
This approach allows teams to adjust structure and execution based on real performance signals, not assumptions. When KPIs guide resourcing decisions, sales operations become proactive instead of reactive.
Learn more about: Guide to Hiring Overseas Employees in 2026
KPIs Only Matter If Someone Acts on Them
Sales ops KPIs are not dashboards for leadership updates. They are signals that tell you where execution is breaking, where efficiency is leaking, and where growth can compound.
When tracked consistently and reviewed with intent, these KPIs help teams move from reactive fixes to deliberate improvement. Forecasts become more reliable. Pipelines become healthier. Hiring and resourcing decisions become grounded in evidence, not pressure.
Many teams reach a point where the data is clear, but execution capacity isn't. That's when flexible support models make sense. Platforms like Activated Scale help teams respond to KPI insights with experienced sales operators, without committing before the motion is proven.
If you're ready to turn sales ops metrics into real execution improvements, let's connect to discuss which support fits your stage.
FAQs
1. What are sales operations KPIs?
Sales operations KPIs measure the efficiency, quality, and predictability of the sales process, including pipeline health, conversion, ramp time, and retention.
2. How are sales ops KPIs different from sales performance metrics?
Sales performance metrics focus on outcomes like revenue or quota. Sales ops KPIs explain how those outcomes are produced and where execution breaks down.
3. How many sales KPIs should a team track?
Most teams benefit from tracking a focused set of KPIs across pipeline health, efficiency, and retention rather than monitoring dozens of metrics without ownership.
4. Which KPI matters most for predictable revenue?
No single KPI stands alone. Predictable revenue comes from understanding how ACV, CLV, pipeline velocity, and conversion rate work together.
5. When should teams revisit their sales ops KPIs?
KPIs should be reviewed whenever sales motion changes, new segments are introduced, or growth stalls unexpectedly. Static metrics rarely reflect dynamic execution.
The Ultimate Guide to Hiring a Salesperson!
Get the step-by-step guide to hiring, onboarding, and ensuring success!